
Introduction
In an earlier article, we focused on batt-type insulation as well as two knit active insulations. We covered how these insulations are manufactured, their benefits, and their drawbacks. We covered issues related to how the insulating value of the insulations are measured by the industry. We presented the results of our measurements of thermal resistance for 10 insulation products.
In this article, we will focus on an important synthetic insulation category: fleece.
We will concentrate on two aspects of fleece that are often discussed when comparing fleece garments with those insulated with synthetic non-wovens or down – weight and warmth. Our testing determined that fleece warmth/weight performance simply cannot compete with the performance of batt type insulations or even that of its fleece cousin, Polartec Alpha. The average of fleeces we tested, which included all weights (except micro), was 0.09 clo/oz./yd2. The average of non-woven insulations we tested was 0.42 clo/oz./yd2. When you compare the warmth-to-weight of finished jackets, the warmth-to-weight ratio of fleece seems to pale next to other technologies.
Editor’s Note: If you’d like a detailed explanation of “clo,” see Stephen’s earlier article.
I have two fleece jackets. For each, the clo/oz. is 0.03. If we look at an average of 12 active insulation jackets, the average for these jackets, which offer competitive performance with fleece is 0.07 clo/oz. One other thing that we found in our examination of 10 different Polartec fleece samples: there is no relationship between fleece weight and fleece warmth!
A Very Brief History of Fleece
Malden Mills was a manufacturer of pile baby bunting and pile toilet seat cover fabrics. Pile fabrics are produced as both woven and knitted fabrics using natural, synthetic, and blended fibers. The key to forming pile is brushing or napping the fabric core structure, raising fibers from the core. The raised fibers produced synthetic fur. The fibers can be trimmed to control the pile height and uniformity and also produce a variety of patterns and textures.
Patagonia was an early adopter of pile fabrics for outdoor wear. Pile fabric provided an alternative to woolen fabrics with advantages in weight, water resistance, and cost. Patagonia worked with Malden Mills to adapt their pile fabrics to the demands of active outdoor activities. In 1985, Patagonia marketed their new products as Synchilla. Malden Mills produced their product under the trade name PolarFleece and Polar Plus. Patagonia grew rapidly after the introduction of its fleece products.
In 1995, Malden Mills suffered a devastating fire at its Massachusetts mill and after rebuilding, faced various financial challenges. Malden Mills went through multiple bankruptcies and was purchased by venture capital firm Versa Capital Management in 2007, which renamed the company Polartec. Polartec was sold in 2019 to Milliken & Company. Along the way, Polartec moved its manufacturing to plants in New Hampshire, Tennessee, China, and Italy.
Although Malden Mills invented synthetic fleece, the company never patented its product. As a result, a variety of manufacturers developed the ability to produce competing products.
Fleece Weights
Polartec Classic Fleece comes in four basic weights: Microfleece, 100, 200, and 300 weights. Table 1 lists the weight range for each weight class as well as equivalent weight classes for Polartec Thermal Pro, Patagonia, and The North Face. (Thermal Pro is manufactured by Polartec and provides a wide variety of surface textures and patterns not incorporated into its “Classic” line of products.)
Table One: Fleece Weights and Equivalents
| Weight Class | Grams/Sq Meter | Oz/Sq Yard | Thermal Pro Equivalent | Patagonia Equivalent | The North Face Equivalent |
|---|---|---|---|---|---|
| Microfleece | <100 | <3 | |||
| 100 | 100-200 | 3-6 | Lightweight | R1 | TKA100 |
| 200 | 200-300 | 6-9 | Midweight | R2 | TKA200 |
| 300 | >300 | >9 | Heavyweight | R3 | TKA300 |
In principle, the higher the weight designation, the heavier and warmer the fleece product will be. We shall see below; this is not necessarily the case.
Test Procedures
- The 1 yard samples were measured for area and then weighed on an A&D SJ-2000HS digital bench scale.
- 10 samples of fleece were obtained from three vendors: Mill Yardage (ML), Rockywoods (RW) and Discovery Fabrics (DF).
- Two test samples were cut from each 1 yard fabric: one across the roll (perpendicular to machine direction); one in the machine direction.
- The thickness of each sample was measured using a Mitutoyo Absolute Digital Caliper and an iGAGING digital thickness gauge. Approximately 12 measurements were taken around the perimeter of each sample.
- The intrinsic thermal resistance (R-value) for each sample was measured on the Guarded Hot Plate. Each sample was tested twice. The Guarded Hot Plate was set to 100 F (38 F). The room ambient during the test was 70 F + 1 F (21 C). The duration of each test was 1 hour. Each sample was heated on the hot plate for 20 minutes prior to starting the test. A detailed discussion of the hot plate and its operation may be found here: The hot plate discussion starts on page 14.
- The thermal resistance values from each of four tests were averaged together to obtain the listed results.
- An infrared image was obtained for each sample at the conclusion of each test.
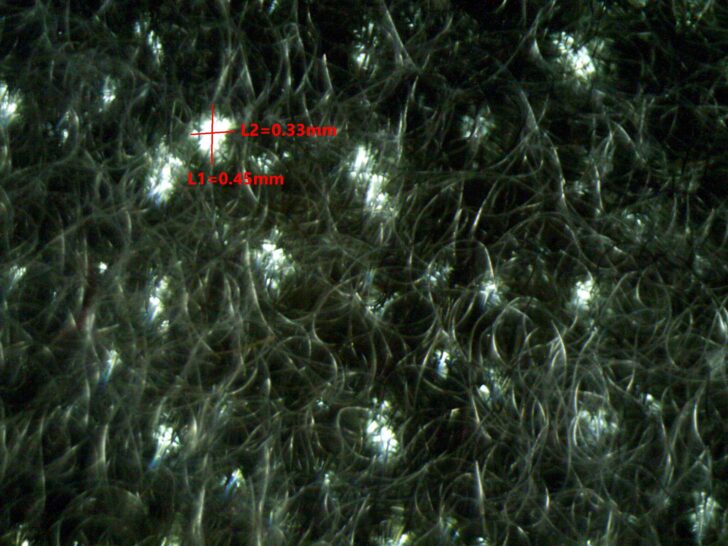
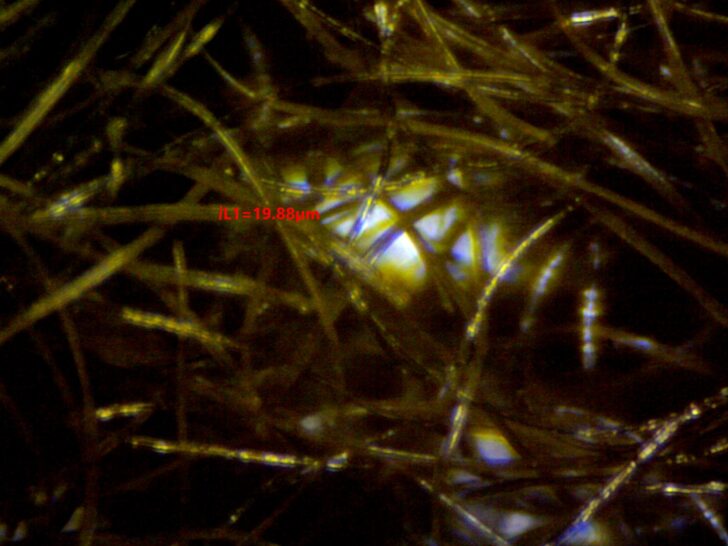
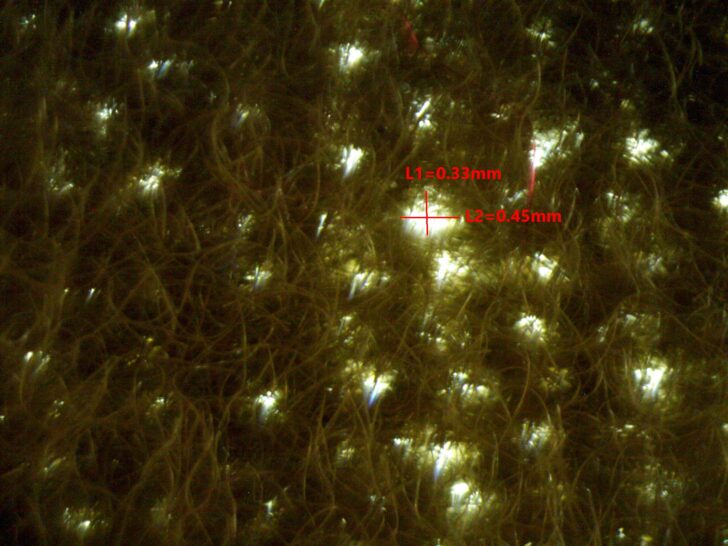
- Photomicrographs were obtained for selected samples to illustrate construction.
Insulation test results are provided in the two tables below. Table 2 provides the physical data for each insulation. Table 3 table provides the measured results and comparative metrics. Four metrics are provided. All are based on Intrinsic values with the air film resistance removed.
Editor’s Note: for an explanation of intrinsic clo values, see Stephen’s earlier article.
The metrics are:
- Measured R-value. This is the result for the piece of insulation tested.
- Intrinsic Clo. This is simply the measured R-value x 1.136.
- Intrinsic clo/oz/yd2. This is Intrinsic clo divided by the measured (not claimed) weight per square yard. This metric will give you the most efficient insulator based on weight.
- Intrinsic clo/inches. This is Intrinsic clo divided by the measured (not claimed) insulation thickness. This metric will give you the most efficient insulation based on volume.
- Intrinsic clo/oz/inch. This is Intrinsic clo divided by weight and thickness. It identifies the most efficient insulation in terms of both weight and thickness.
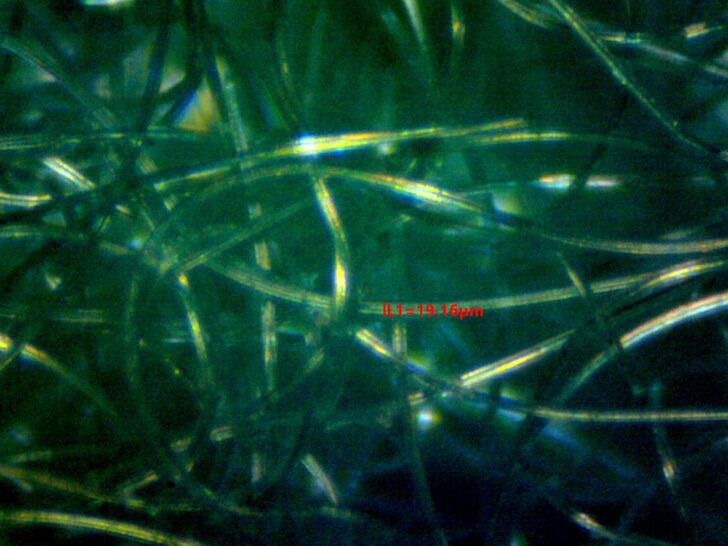
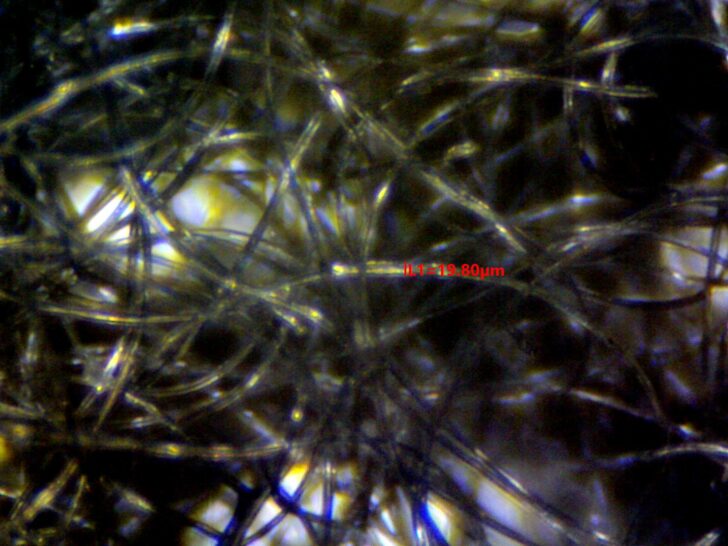
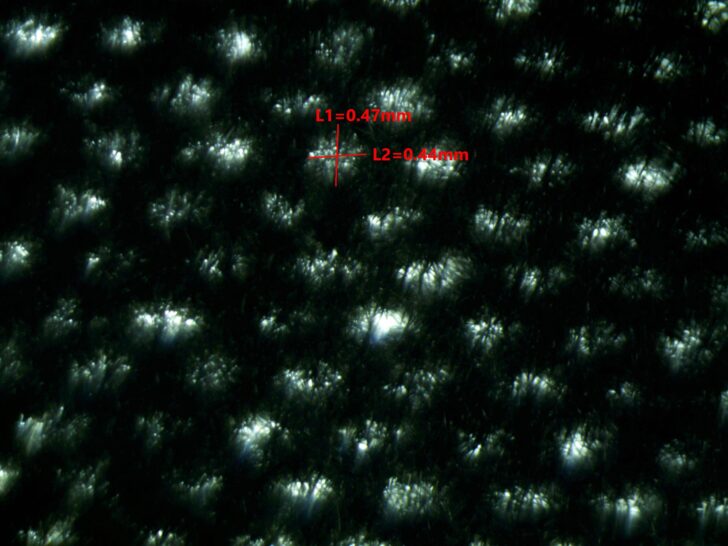
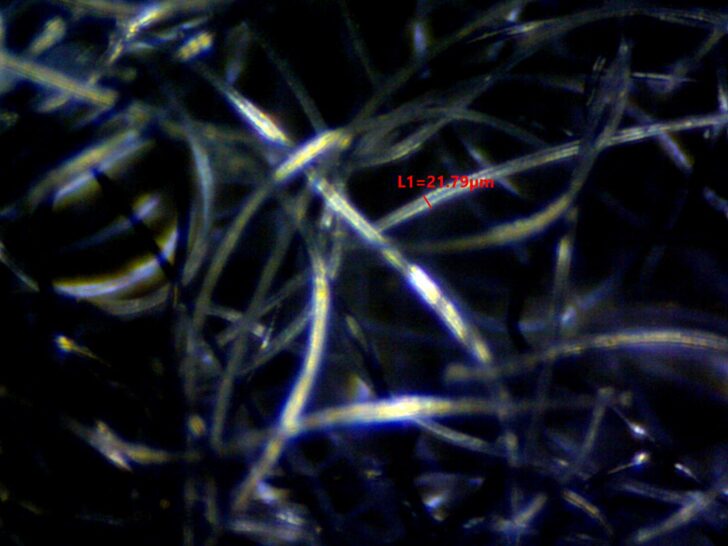
Selected photomicrographs are shown below:
Some of these samples are fairly dense, so the underlying core fabric structure from which the fibers are napped cannot be readily seen. The image for Thermal Pro Lightweight, low mag, shows the clearest image of the underlying structure because there is nearly no pile on this fabric. Typically, the fiber diameter is about 20 micrometers. This is comparable to fiber diameter in continuous filament batt insulations that we tested previously and in the middle-to-upper range of short-staple batt insulations that we tested previously.


Test Data
Table 2: Physical Dimensions
| Insulation | Insulation Type | Claimed Weight per Square Yard (oz) | Measured Area (sq yard) | Weight (oz) | Measured Weight per Square Yard (oz) | Approximate Loft (in) |
|---|---|---|---|---|---|---|
| Polartec 100 9180 Double Velour MY | Fleece | 9.6 | 1.83 | 15.05 | 8.22 | 0.247 |
| Polartec 200 7614 Double Velour MY | Fleece | 13.9 | 1.87 | 15.35 | 8.21 | 0.228 |
| Polartec 300 9381 FQ Double Velour MY | Fleece | 20.8 | 1.88 | 17.95 | 9.55 | 0.204 |
| Polartec 100 Pewter RW | Fleece | 9.6 | 1.89 | 10.45 | 5.53 | 0.16 |
| Polartec 200 Baby Blue RW | Fleece | 13.9 | 1.94 | 19.05 | 9.82 | 0.219 |
| Polartec 300 Coyote RW | Fleece | 20.8 | 1.74 | 19 | 10.92 | 0.155 |
| Ptec Thermal Pro Midweight HiLoft Grn MY | Fleece | 9.1 | 2.094 | 20.4 | 9.74 | 0.243 |
| Ptec Thermal Pro HiLoft Azurro MY | Fleece | 6.1 | 1.94 | 12.45 | 6.42 | 0.216 |
| Ptec Thermal Pro Lightweight Olive MY | Fleece | 5.4 | 1.97 | 11.25 | 5.71 | 0.104 |
| Ptec Thermal Pro 4230 Silver Extreme DF | Fleece | 9.1 | 2.18 | 19.2 | 8.81 | 0.234 |
Table 3: Thermal Resistance Data
| Insulation | Hot Plate Measured R value | Hot Plate Intrinsic Total Clo | Hot Plate Intrinsic Clo/oz /Yd2 | Hot Plate Intrinsic Clo/In | Hot Plate Intrinsic Clo/Oz/In **** | Claimed Clo/ Oz/Yd2 |
|---|---|---|---|---|---|---|
| Polartec 100 9180 Double Velour MY | 0.78 | 0.89 | 0.11 | 3.59 | 0.44 | 0.16* |
| Polartec 200 7614 Double Velour MY | 0.72 | 0.82 | 0.1 | 3.59 | 0.44 | 0.14* |
| Polartec 300 9381 FQ Double Velour MY | 0.59 | 0.67 | 0.07 | 3.29 | 0.34 | 0.11* |
| Polartec 100 Pewter RW | 0.54 | 0.61 | 0.11 | 3.83 | 0.69 | 0.16* |
| Polartec 200 Baby Blue RW | 0.65 | 0.74 | 0.08 | 3.37 | 0.34 | 0.14* |
| Polartec 300 Coyote RW | 0.46 | 0.52 | 0.05 | 3.37 | 0.31 | 0.11* |
| Ptec Thermal Pro Midweight HiLoft Grn MY | 0.72 | 0.82 | 0.08 | 3.37 | 0.35 | .185* |
| Ptec Thermal Pro HiLoft Azurro MY | 0.69 | 0.78 | 0.12 | 3.63 | 0.57 | .185* |
| Ptec Thermal Pro Lightweight Olive MY | 0.34 | 0.39 | 0.07 | 3.71 | 0.65 | .16* |
| Ptec Thermal Pro 4230 Silver Extreme DF | 0.69 | 0.78 | 0.09 | 3.35 | 0.38 | .21* |
* From manufacturer’s published specification. Precise calculation method unknown for all manufacturer’s claims
**** Based on measured thickness
In order to easily compare the performance of fleece insulation with batt insulation, we reproduce as Table 4 the thermal performance of batt insulation from the article By the Numbers: Thermal Performance Measurements of Synthetic Insulations.
Table 4: Thermal Performace of Batt and Knitt Insulations
| Insulation | Hot Plate Measured R value | Hot Plate Intrinsic Total Clo | Hot Plate Intrinsic Clo/oz /Yd2 | Hot Plate Intrinsic Clo/In **** | Hot Plate Intrinsic Clo/Oz/In | Claimed Clo | Watts Hot Plate |
|---|---|---|---|---|---|---|---|
| Climashield Apex 6oz | 3.03 | 3.44 | 0.58 | 2.41 | 0.41 | 0.82 oz/yd2* | 3.5 |
| Primaloft Gold 6oz | 2.94 | 3.34 | 0.47 | 3.09 | 0.43 | 0.92 oz/yd2*,*** | 3.5 |
| Climashield Apex 5oz | 2.5 | 2.84 | 0.59 | 2.81 | 0.59 | 0.82 oz/yd2* | 4.5 |
| Primaloft Gold 3oz | 1.57 | 1.78 | 0.55 | 2.97 | 0.91 | 0.92 oz/yd2*,*** | 5.3 |
| Thinsulate 200G CDS | 1.54 | 1.75 | 0.24 | 3.02 | 0.42 | 2.2R*,*** | 5.9 |
| Primaloft Silver 3oz | 1.23 | 1.4 | 0.45 | 2.54 | 0.82 | .79 oz/yd2*,*** | 6.8 |
| Climashield Apex 2.5oz | 1.07 | 1.22 | 0.51 | 3.12 | 1.32 | 0.82 oz/yd2* | 7.9 |
| Polartec Power Fill 100 | 0.87 | 0.99 | 0.36 | 3.19 | 1.15 | 1.2 Clo Total* | 8.8 |
| Freudenberg KHT | 0.86 | 0.98 | 0.49 | 2.57 | 1.28 | 1.35 Total* | 8.8 |
| Polartec Alpha | 0.54 | 0.61 | 0.2 | 2.56 | 0.84 | 0.87 Clo Total*,** | 11.3 |
| Polartec Alpha Direct | 0.36 | 0.41 | 0.15 | 2.27 | 0.84 | 12.9 |
* From manufacturer’s published specification. Precise calculation method unknown for all manufacturer’s claims.
**https://backpackinglight.com/forums/topic/56056/#post-2080930, alternate source claims .37 clo/oz/square yard
*** Scrim weight included in measured weight
**** Based on measured thickness
Discussion of Results
A number of issues are illustrated in these results.
- Compared to batt insulations tested previously, fleece provides relatively little warmth. Fleece ranges from R-0.34 to R-0.78, while the batt insulations that were tested provided R-0.86 to R-3.03.
- Compared to knit insulations previously tested, fleece provides similar thermal performance. The Alpha insulations previously tested ranged from R-0.36 to R-0.54. (Note: we tested mid-weight versions of Alpha and Alpha Direct. So somewhat lower or higher values should be found in lighter or heavier fabric weights.) Thus, one can conclude that Alpha insulations perform similarly to fleeces with one important exception – the Alpha insulations are considerably lighter. This can be seen from the Clo/oz/yd2 metrics. Alpha insulations can be less than half the weight of fleece.
- Compared with batt insulations, fleece is heavy. This may be seen, again, by comparing the clo/oz/yd2 metrics.
- When we compare the fleece weights, fleece sample names, and thermal performance, we find there is little agreement with our expectations that product weight (100, 200, 300 or lightweight, midweight or heavyweight) is related to warmth. We will look at this from a couple of angles.
Table 5 shows the fleece sample names, which include the weight class (100, 200, 300 or lightweight, midweight or heavyweight), the measured weight per square yard, the expected weight class, based on actual measured weight and referencing the weight class designations found in table 1, above, and finally, the measured clo/oz/yd2 value.
Table 5: Comparison of Actual and Expected Weight Class
| Insulation | Measured Weight per Square Yard (Oz) | Expected Weight Class per Table 1, based on measured weight | Hot Plate Intrinsic Clo/oz /Yd2 |
|---|---|---|---|
| Ptec Thermal Pro HiLoft Midweight Azurro MY | 6.4 | 200 | 0.12 |
| Polartec 100 Pewter RW | 5.5 | 100 | 0.11 |
| Polartec 100 9180 Double Velour MY | 8.2 | 200 | 0.11 |
| Polartec 200 7614 Double Velour MY | 8.2 | 200 | 0.1 |
| Ptec Thermal Pro 4230 Silver Extreme DF | 8.8 | 200 | 0.09 |
| Ptec Thermal Pro Midweight HiLoft Green MY | 9.7 | 300 | 0.08 |
| Polartec 200 Baby Blue RW | 9.8 | 300 | 0.08 |
| Polartec 300 9381 FQ Double Velour MY | 9.6 | 300 | 0.07 |
| Ptec Thermal Pro Lightweight Olive MY | 5.7 | 100 | 0.07 |
| Polartec 300 Coyote RW | 10.9 | 300 | 0.05 |
Based on product name, only 6 of 10 samples correspond to the expected weight class.
However, our expectation with fleece is that warmth and weight increase together. We would expect the highest weights and highest insulation values for class 300 products. We would also expect the lowest weights and lowest insulation values for the class 100 products. This is not what happens. Polartec 100 Pewter RW, the lightest fabric, has the second-highest thermal performance. The very lowest thermal performance goes to Polartec 300 Coyote RW, which is the heaviest fabric. The four heaviest fabrics are in the bottom five performers for warmth.
There is clearly a mismatch between product names and product performance.
Is there a way to determine product performance based on product physical characteristics? Absolutely.
Member Exclusive
A Premium or Unlimited Membership* is required to view the rest of this article.
* A Basic Membership is required to view Member Q&A events

Discussion
Become a member to post in the forums.
Hi Jerry: I think my Warm Wet Wet article demonstrated that with minimal moisture intrusion, synthetic insulation looses substantial warmth. I would not want to rely on wet synthetic insulation for survival. I would rather dispel that myth. I don’t know that you can even claim warmer (rather than the industry standard-warm) when wet. In order to do that you need to state if wet means damp, saturated, or somewhere in between. The problem is, it’s pretty hard to find head to head studies that relate the warmth of synthetic and down with similar levels of moisture intrusion. Until that is done, and it is something I hope to do, I think the prudent outdoors person should strive to keep any insulation as dry as possible.
By the way, here is what is Patagonia says about its DAS Light in this regard: Lightweight 100% recycled polyester PlumaFill insulation offers the warmth and packability of down but performs when damp
This is certainly more responsible than claiming “warm when wet”. Of course, we have no idea how wet is damp, nor do we know the level at which it performs when damp. We can just be certain that it performs.
Concerning the weight of down vs synthetic. There are numerous kinds of synthetic insulation and various fill power downs that are available. These will impact the weight/warmth relationship. Of course, you don’t use insulation. You use a finished product. The product weight relationships will depend on the specific type of synthetic insulation or down, construction details, fabrics, features and much more. Of course, down is more efficient per unit weight than most synthetics. However, as the fill power goes down, the scales become somewhat more balanced in terms of weight and cost. Just as something to ponder, below is a little information I have gathered on some jackets.
I thought I could save some weight by replacing my Micro Puff with a Montbell Superior Down Jacket. You can see, they are similar in warmth. The weight difference is about 61 grams or 2 ounces. I concluded it was not worth laying out $179 to save 2 ounces. Now, if I were pondering which to buy today, I would pick the Montbell Superior Down and save 2 ounces and $70 and maybe a little pack space.
Just remember that the various ‘grades’ of down shown in the above table may not mean anything at all. The idea of 1000 down is mildly amusing.
Cheers
It might be packing my fears, but I would always have an extra, dry wool base layer for winter trips. One I wear, one I pack. I also bring the down pants for in-camp comfort. I have headed out on an overnight at 20F and returned at minus 20F with a strong headwind and blowing snow. We cross flowing creeks and risk wet feet (yes even at minus 20 sometimes, there can be open water). I want a dry everything in my pack ready to put on to be warm and dry. Obviously your circumstances vary.
I tend to agree with Karen.
We have waded open creeks in the snow. Well, they were too wide.
The water is not so bad – you don’t feel anything!, but standing around afterwards on the snow is ghastly! We drop gaiters to stand on, drop foam sit-upon to sit on, and put thick (Darn Tough) socks on quickly. Never mind the towel!
Cheers
PS: we also carry spare dry underwear for the tent.
Thanks all. Karen and Roger you both make convincing points for carrying the extra base layer on planned overnights. However, in terms of unplanned (emergency) overnight on day hikes I’m still torn, as the extra base layer alone would not provide the needed warmth overnight (on a planned overnight I’d have a winter bag so they’d be fine). Of course falling into water does provide great pause and I could carry both. Day pack is about 15# already. Do I go to 16#? The more weight, the more likely I get tired and something happens…
if one was unfortunate enough to fall into the water, you’d definitely want synthetic layers- it gets wet obviously BUT it dries much quicker
you can look up the videos on YouTube, but the Special Forces have adapted a rewarming drill- no stopping and trying to build a fire, they wring out their layers (synthetic layers) as best as possible and then start hiking. The hiking dries out the damp layers, quicker than you would think with the right layers.
If it’s cool to cold, I’m hiking with an synthetic insulation active layer (Polartec Alpha) and in my pack is a Apex parka and a a Apex half bag (more like a 3/4 bag :) ) for an unexpected night out
yeah, exactly Mike, that video has been posted before on BPL
you do not want even synthetic to get wet, but it’s better than down
I have measured the temperature difference across synthetic insulation to be cut in half if it’s wet, then it gradually increases back to normal as it dries out.
That would be equivalent to the R value being halved when it’s totally wet, except it’s not actually conduction that’s happening, it’s evaporation. Half the heat is consumed with evaporating water. As the water gradually evaporates, less heat is needed to evaporate the rest so the temperature difference across the insulation gradually increases.
^ that makes sense
they have another video floating around where they cut a hole in the use and jump in and if they’re backpacking, they wring the clothing out as best as they can they set up their shelter, get into their sleeping bags, fire up the stove for some hot liquid calories and eventually dry out
tough guys!!!
Hi Jerry and Mike: You two are probably some of the most experienced backpackers in the community. I get your point. On the way to gaining your experience you have obviously lived through and learned from the mistakes that we all make. You know the limitations of your equipment, you know how to deal with it and you know how to survive. On the other hand, there are great many people who purchase gear and rely on the claims they read in manufacturer’s advertisements and ill-informed product reviews and then go forth into unforgiving environments secure in the knowledge that they will, in this case, stay warm when their insulation gets wet. Of course they won’t. You know what to do about it. They probably don’t. For every pound of water someone needs to dry from their clothes, they are expending 252kcal of energy, just to vaporize the water. In addition, you need to warm the water to get it to vaporize. Suppose you need to warm 1 pound of water from 35F to 75F. That requires another 100 kcal of energy. So getting wet is not just a matter of suffering through getting dry. You need to supply the energy for drying and still have enough left to complete your activity. We all know the consequences this can subject a hiker to. The least people should know is that they cannot trust their synthetic or any other insulation to keep them dry when wet and they should do all they can to avoid that possibility. Here is one of those inspirational videos of someone walking their clothes dry. At least these clothes are well designed to get rid of moisture trapped within a garment. Others will find it harder to dry insulation that is encapsulated in fabrics that typically have low air permeability, low MVTR and are designed to make it hard for water to get in, which means, it will have a hard time getting out.
Good points. Synthetic (or fleece) is not a panacea, just better than down. Don’t get wet. Manufacturers may overstate the advantage of synthetics.
I appreciate your experiments and articles.
During a brief immersion I’ve found that a heavyweight base layer tends to trap air against the skin so that I didn’t get too cold even below zero. Paramo clothing and the old Buffalo pertex and pile excel in these situations as they allow the water out through the fabric.
the Special Forces have adapted a rewarming drill- no stopping and trying to build a fire, they wring out their layers (synthetic layers) as best as possible and then start hiking. The hiking dries out the damp layers, quicker than you would think with the right layers.
It works too.
Yeah, I fell through the snow into the creek. Italian fleece trousers, We just got going asap, once I had wrung them out.
Cheers
Become a member to post in the forums.