Introduction
Thermal degradation of synthetic insulation has been a long-time concern in the backpacking community. In July, I wrote an article that explored this topic and described how well two types of synthetic insulation, Climashield Apex 6 osy (ounces per square yard) and Primaloft Gold 6 osy withstood 10 cycles of washing and drying. In that study, Climashield apex demonstrated almost no loss of thermal performance. Primaloft demonstrated minimal loss of thermal performance (about 9%).
Both types of insulations can withstand repeated washing and drying with little loss of performance.
However, backpackers subject their synthetic insulation pieces to another form of torture: compression. Compression occurs when packing garments or sleeping bags into stuff sacks. This can occur repeatedly during a multi-day activity.
This article is my first attempt to quantify whether repeated compression results in the loss of thermal performance. And the answer: a resounding maybe. This round of testing provides some short-term indications. In the short term, minor degradation can occur. In the long term, the significance of this degradation is unclear. What is clear is that this type of testing is extremely time-consuming and assessing long-term performance will require far more test iterations than were completed here. But in the short term, we can say this:
- Degradation is somewhat related to the number of compression cycles.
- Degradation is not influenced by the magnitude of compression, within the compression range studied (0.22 to 0.88 pounds per square inch).
- Thermal performance after compression for an individual test may deteriorate or actually improve. After a compression and recovery cycle, the air spaces within the insulation may change in volume and that change may not be uniform between test cycles. The performance variation in response to repeated compression cycles is small and the direction of change is inconsistent.
- The same types of insulation were tested for this article as were tested for the prior degradation article referenced above. Here, the results are reversed: Climashield Apex showed a greater loss of thermal performance than Primaloft Gold in response to compression. The statistical evidence for the degradation of Primaloft Gold is very weak.
- Finally, the relationship between changes in thermal performance and changes in loft is inconsistent. Part of this may stem from the difficulty of measuring the true effective thickness of high loft insulation.
How We Tested
Compression takes place through two very different mechanisms:
- Stuffing, in which a garment or sleeping bag is loaded, under some pressure, into a stuff sack.
- Utilization pressure, the pressure that results from lying in your sleeping bag or wearing a backpack over a jacket. Part of this pressure may occur beneath backpack straps or may occur due to the pressure of the pack itself on the underlying insulation.
I chose to attempt to replicate pressure placed directly on insulation in the bottom of a sleeping bag by an average male. I estimated pressures exerted by the average adult male using references 1 and 2. Based on these sources, I assumed an average weight of 202 pounds (92 kg) and an average skin surface of about 25 square feet (2.3 square meters).
The average pressure exerted on the bottom of a sleeping bag was calculated to be approximately 0.14 psi.
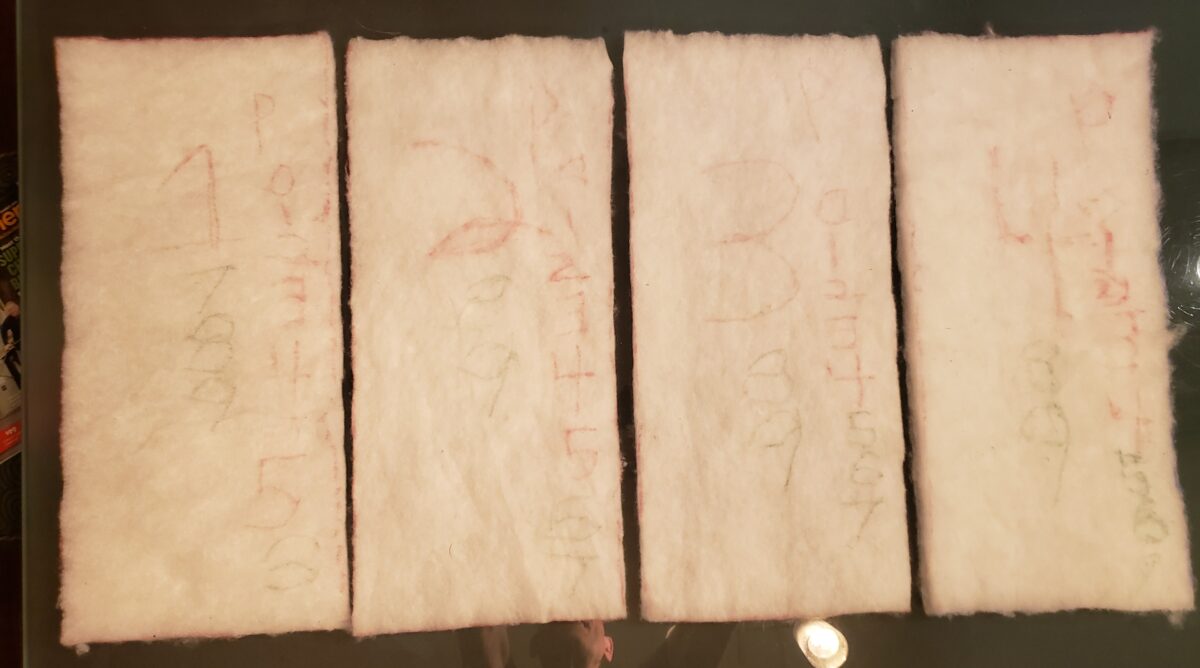
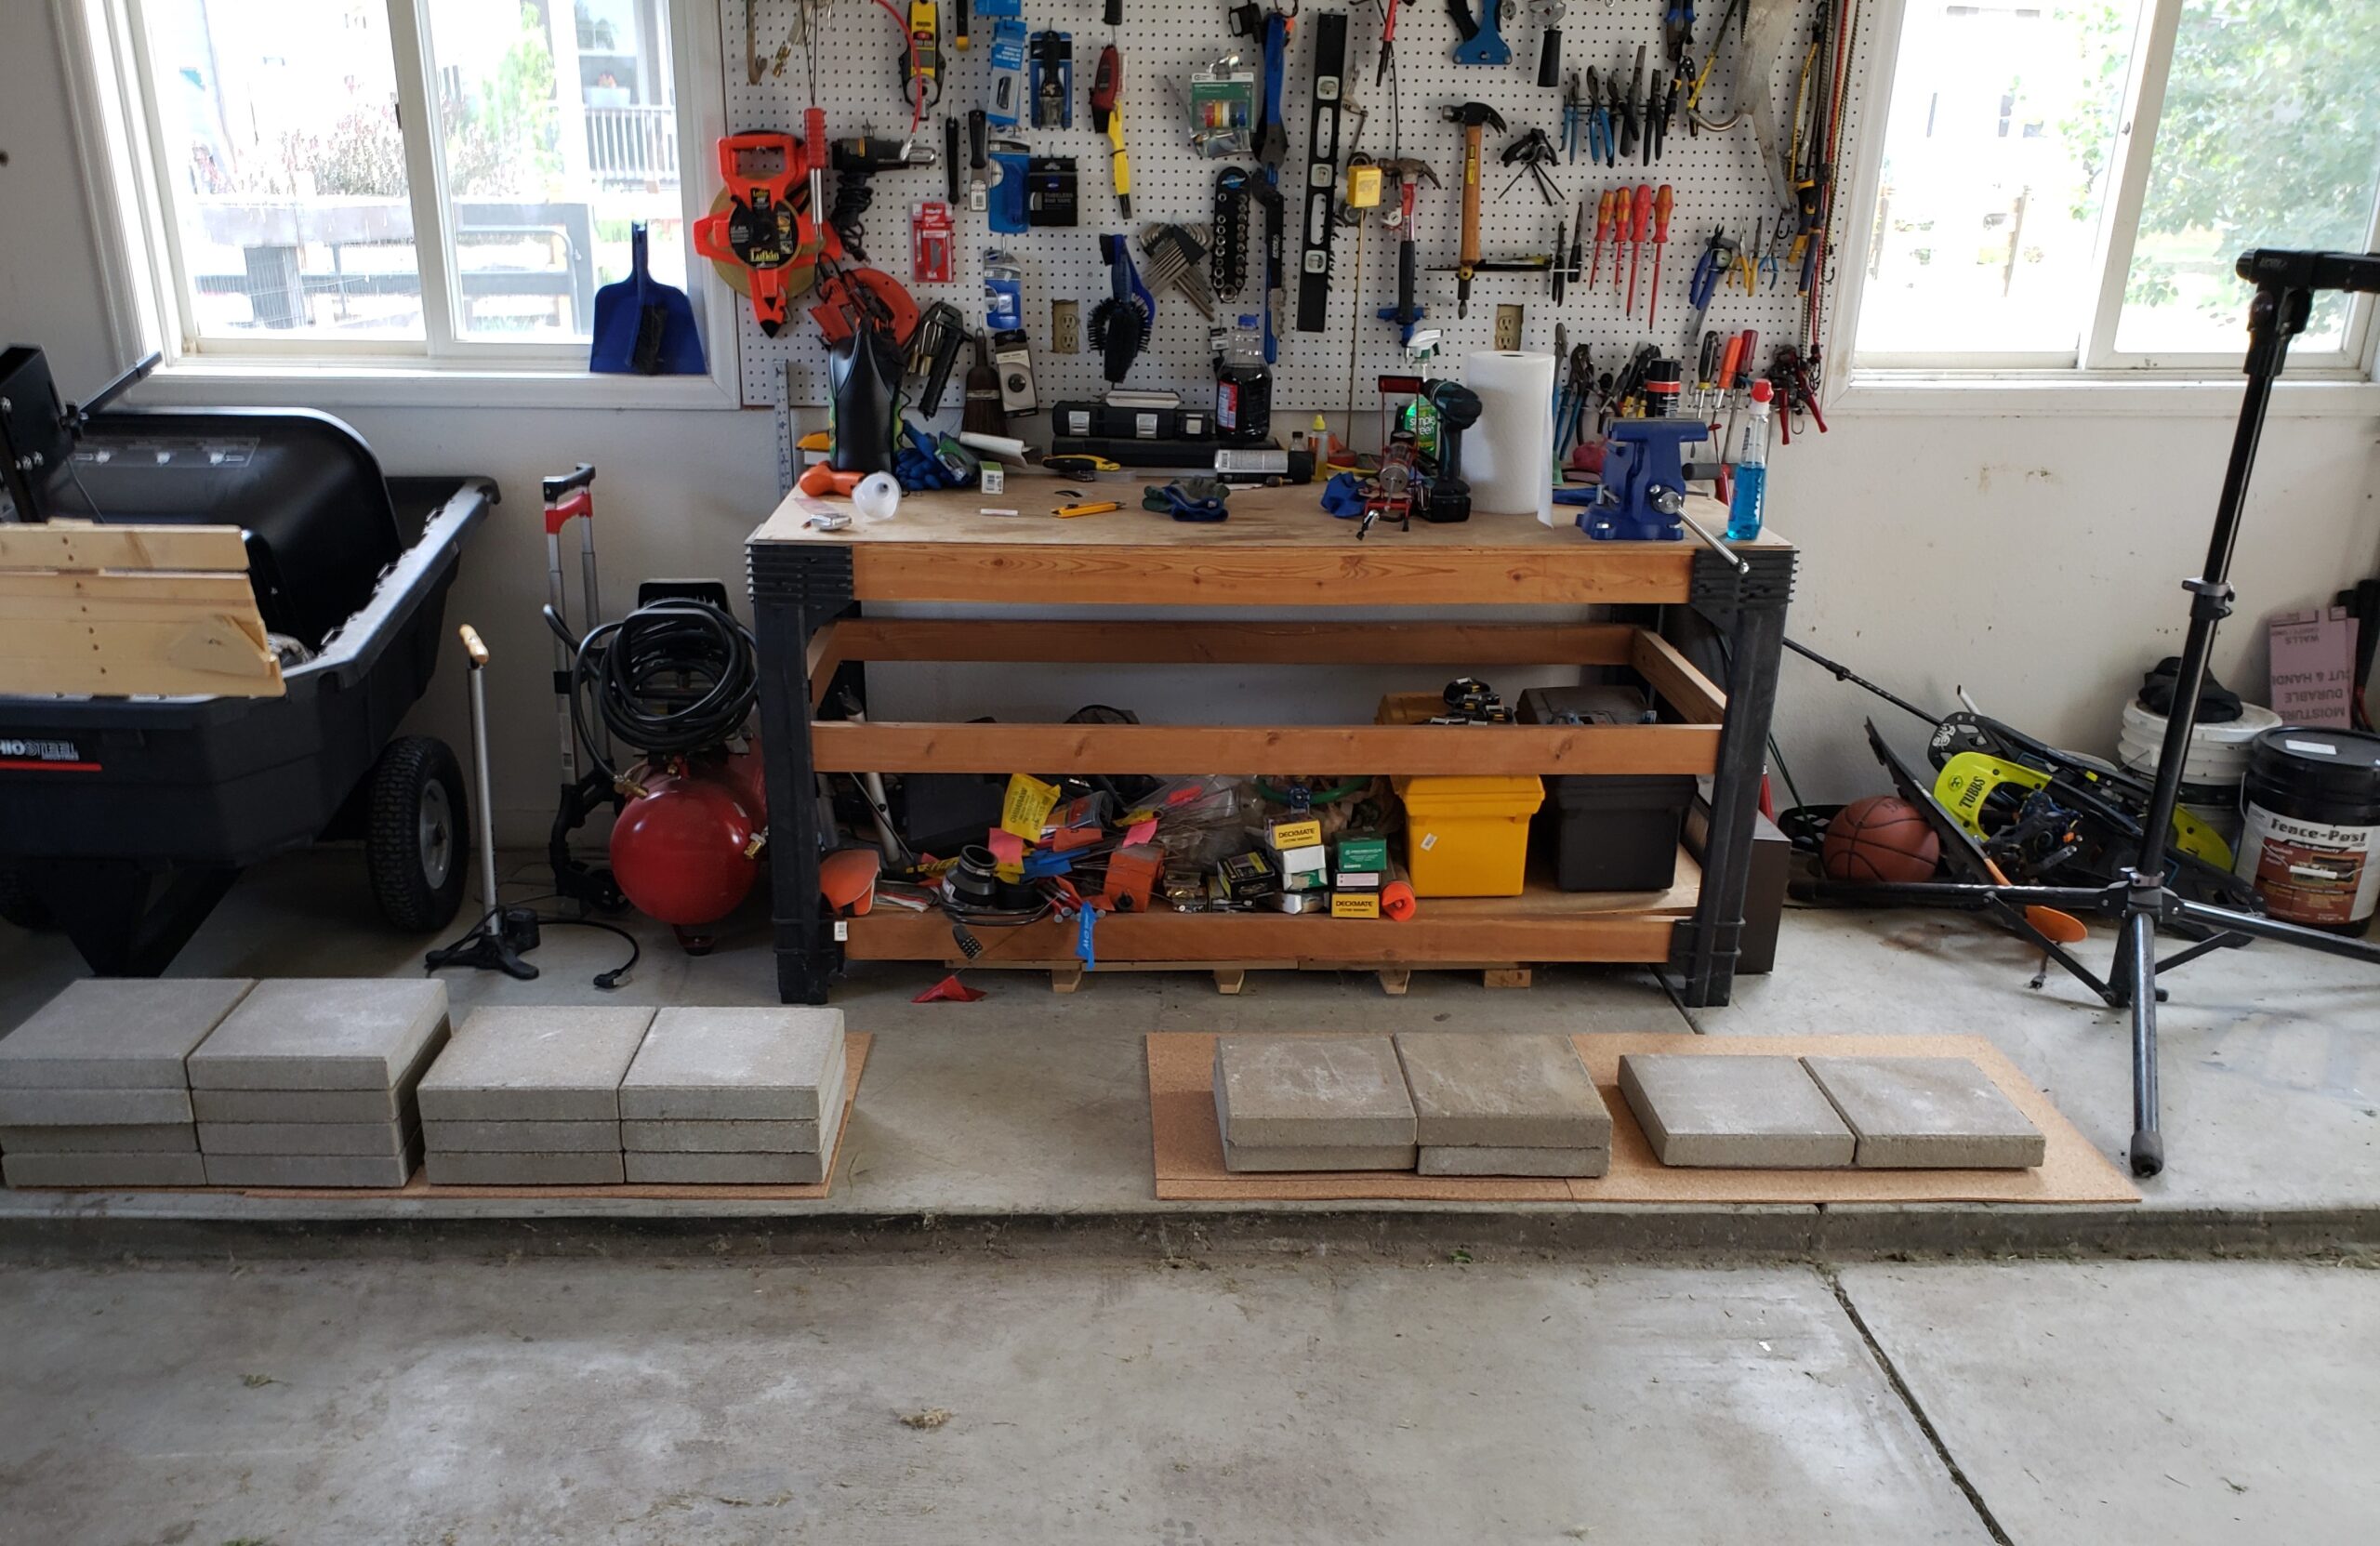
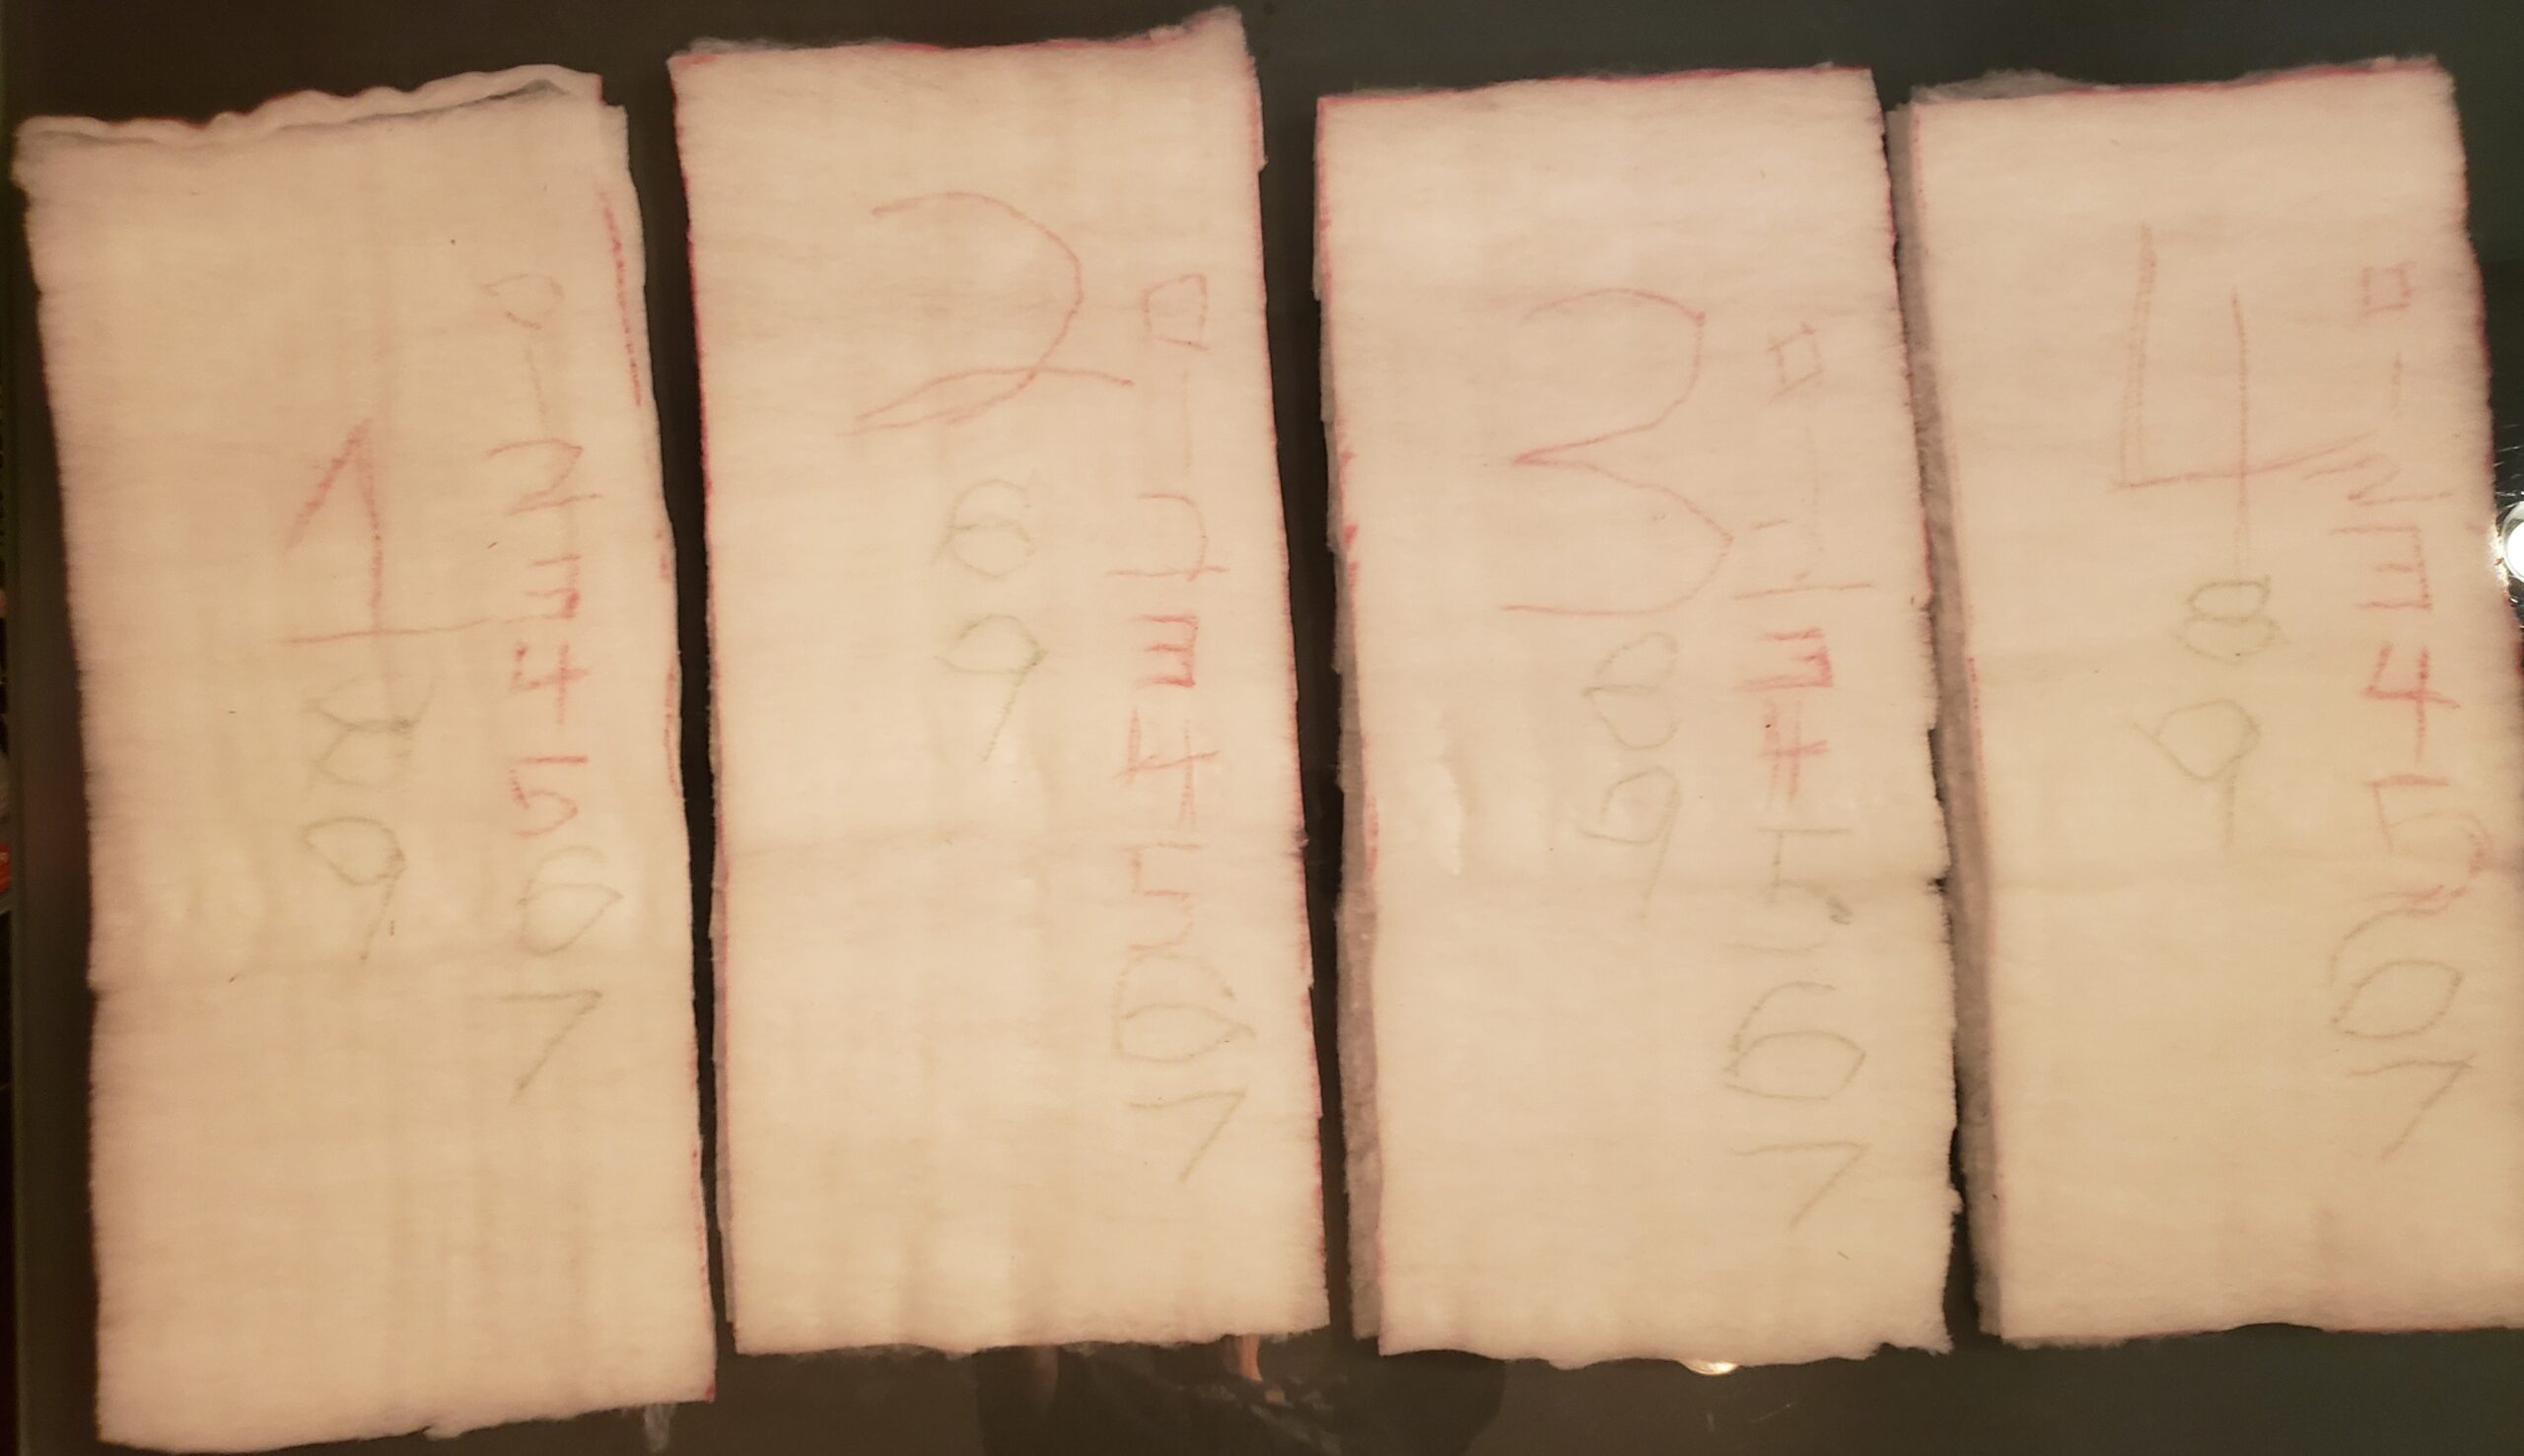
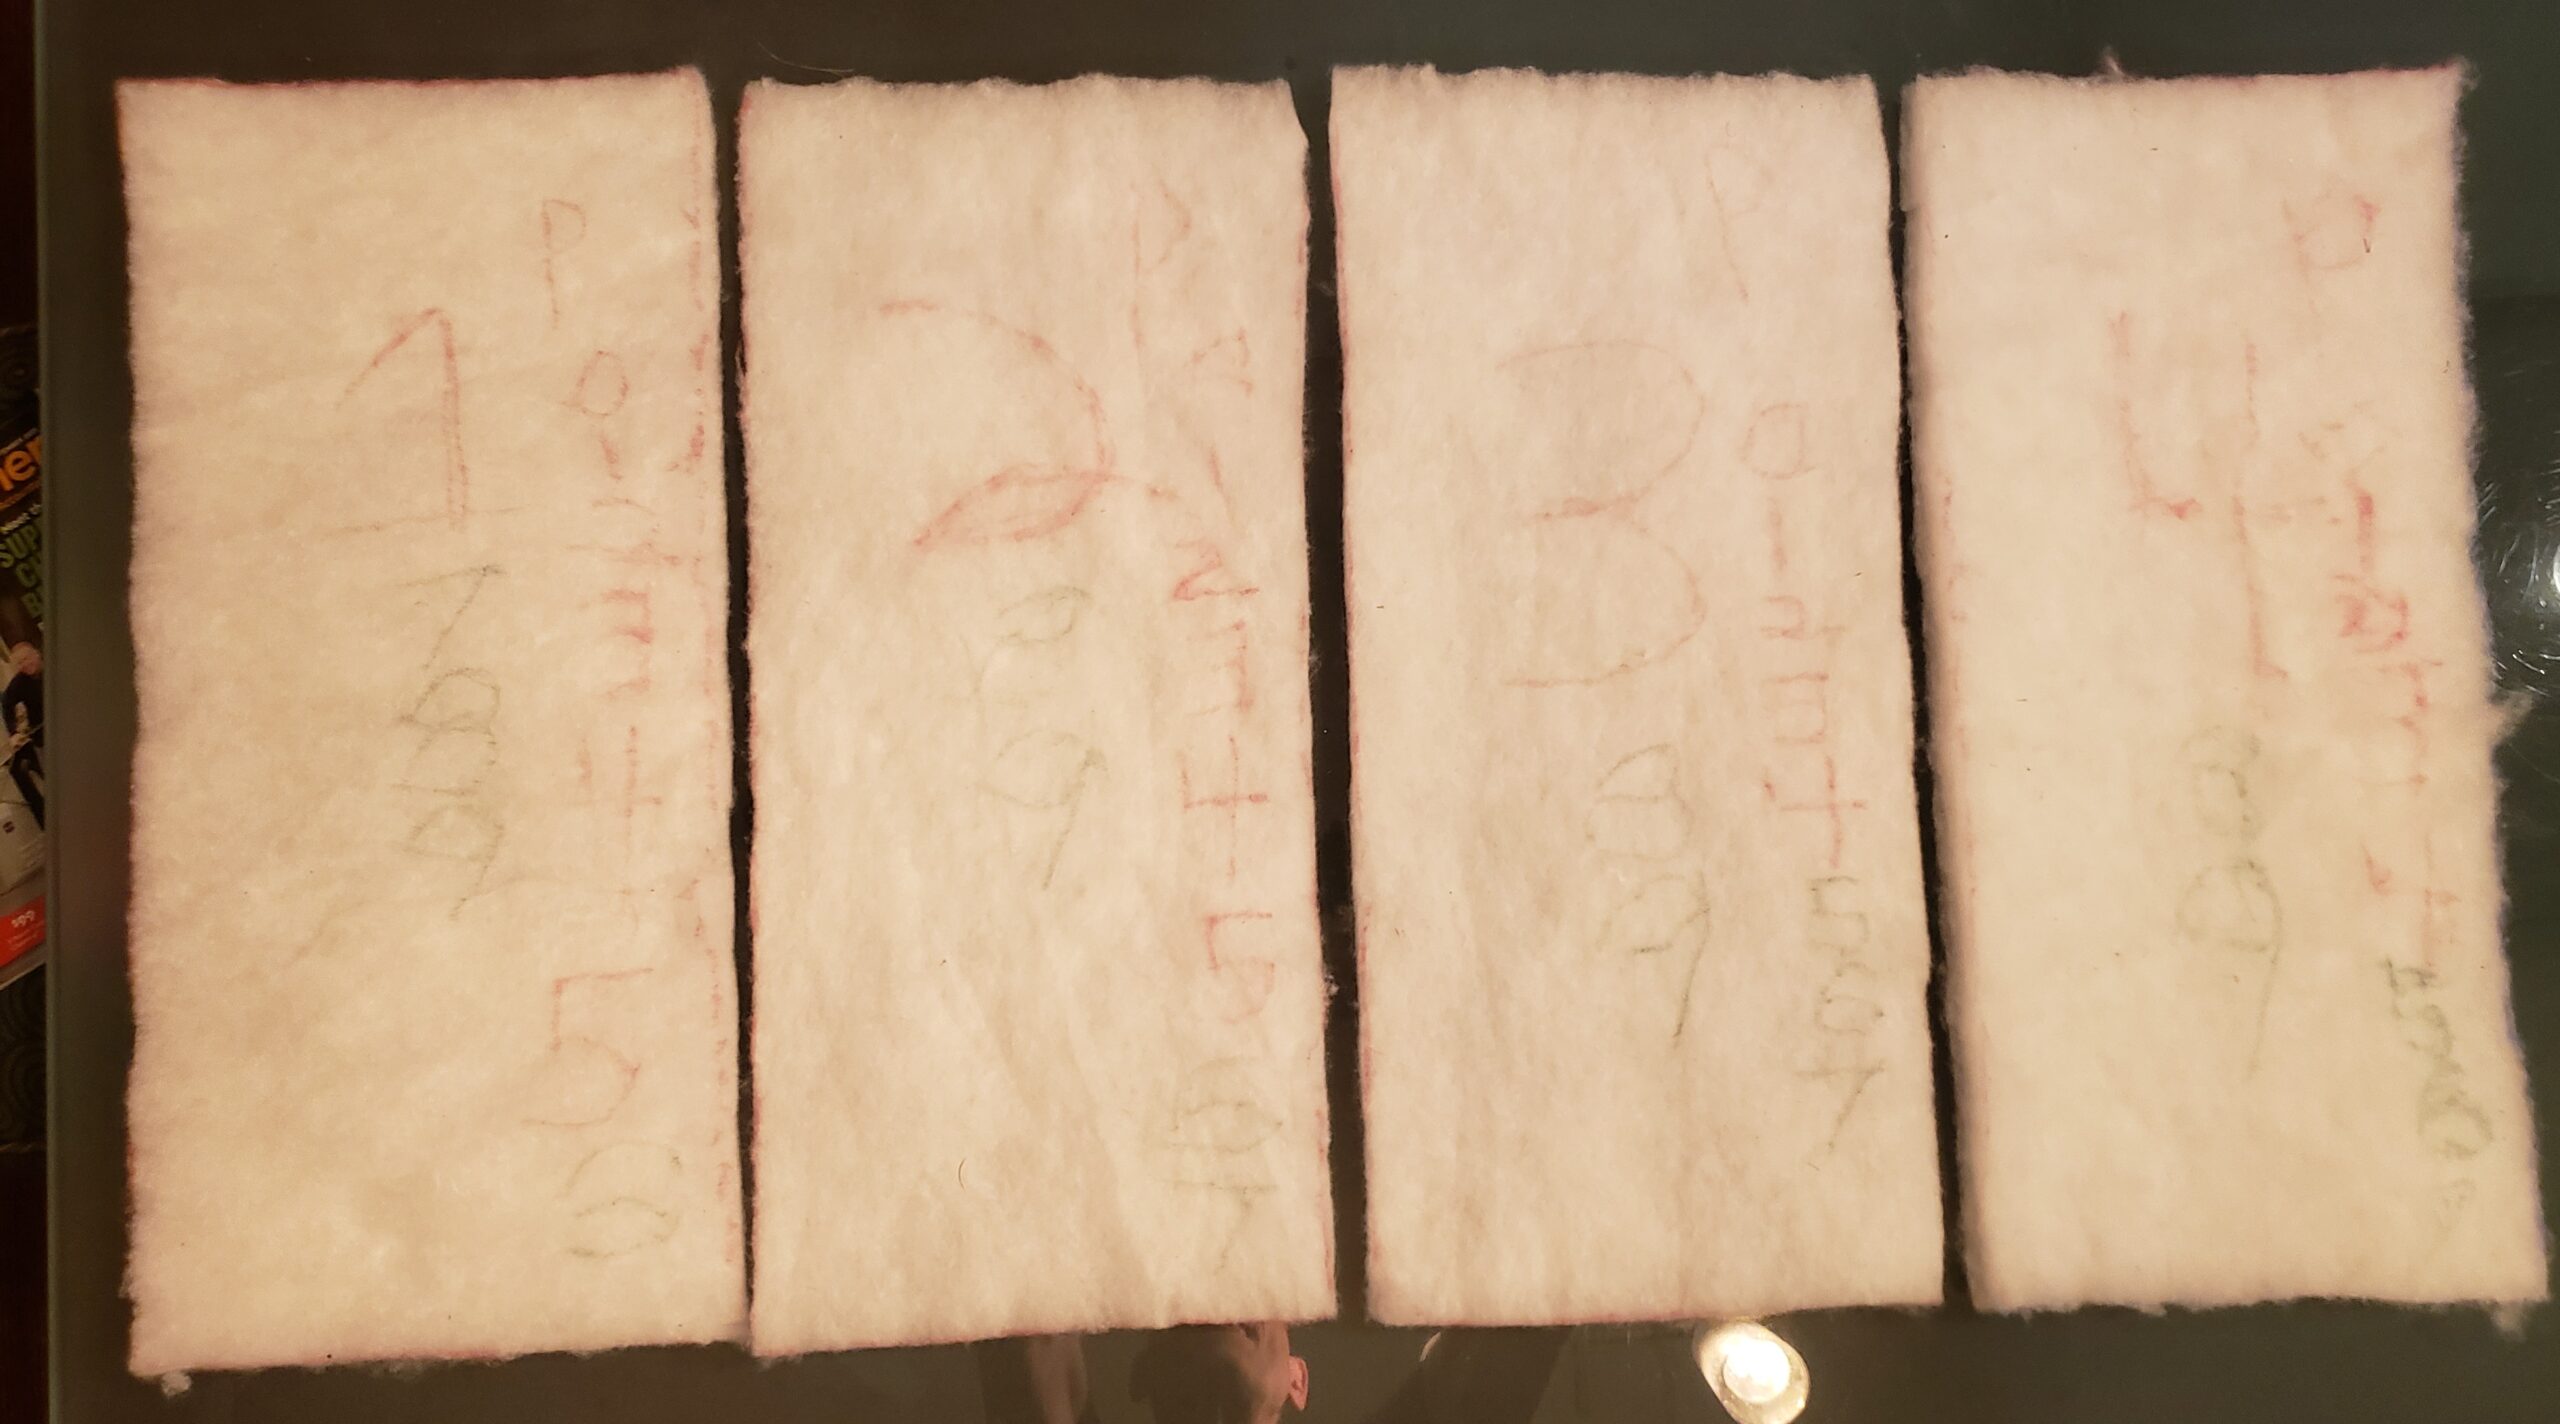
Two types of insulation were tested: 6 osy Primaloft Gold and 6 osy Climashield Apex. Four samples of each were cut from unused insulation to fit my guarded hot plate apparatus. Each sample was compressed by placing concrete pavers on each sample. Each paver weighs 23.4 pounds (10.6 kg). Sample 1 received two pavers, laid side by side, which produces approximately the same pressure as our average male. Sample 2 received four pavers. Sample 3 received six pavers. Sample 4 received eight pavers. Thus, sample 4 received about four times the pressure produced by our average male.
Samples were compressed for approximately 24 hours. After 24 hours, samples were removed and allowed to recover for about 10 hours. Next, the samples were tested for thermal resistance (R-value) on the guarded hot plate. Each test ran for 1 hour. Any test result that appeared to show elevated deviation was retested. Prior to testing, each sample sat on the hot plate for 20 minutes. The guarded hot plate surface was maintained at 100 °F +/- 0.2 °F (37.8 °C +/- 0.1 °C). The ambient environment 20 inches (50.8 cm) above the guarded hot plate was maintained at 71.5 °F +/- 0.5 °F (21.9 °C +/- 0.3 °C).
Each sample was measured for loft following the recovery period. When fabric thickness is measured, a weighted plate is placed on the test sample and the distance from the underside of the plate to the sample mounting surface is measured. High loft insulation cannot support much weight without compressing, so the weight of the plate must be selected carefully. In this case, a rectangle of extruded polystyrene foam with additional small lead weights was used. This plate, along with weights, weighs 5.1 ounces (145 g). A Mitutoyo Digimatic caliper was used to measure the distance from the underside of the plate to the mounting surface. Two measures were taken near corners on each long side. The resulting four measurements were averaged to calculate the loft to the nearest hundredth of an inch. By necessity, this is a somewhat compressed loft. The actual non-compressed loft is unknown and not easily determined due to thickness variation across each insulation sample. Since the sample sits on the guarded hot plate without the 5.1 ounces (145 g) imposed by the measurement plate, the sample loft on the guarded hot plate will tend to be greater than the measured loft. Our loft measurement provides a physical loft dimension that reflects changes in the fabric resilience which will track changes in the compressive strength of the sample fibers. Thus, thermal performance measurements on the hot plate cannot be expected to track measured loft except in the case of substantial changes in measured loft. Substantial changes in loft did not occur.
Test Results
Table 1 shows physical data for the two sets of four insulation samples.
Table 2 shows “as found” R-value and R-values measured after each of the 9 compression tests.
Table 3 shows “as found” loft and loft measured after each of the 9 compression tests.
<!–member-only-content–>
Table 1: Test Sample Physical Data
| Insulation | Weight (g) | As Found Loft (inches) | As Found R-Value | Total Weight on 212 sq in sample (lb) | Test Compression (PSI) |
|---|---|---|---|---|---|
| Apex 1 | 26 | 1.15 | 2.84 | 46.8 | 0.22 |
| Apex 2 | 26 | 1.14 | 2.87 | 93.6 | 0.44 |
| Apex 3 | 28 | 1.16 | 2.98 | 140 | 0.66 |
| Apex 4 | 27 | 1.16 | 2.81 | 187.2 | 0.88 |
| Average | 26.75 | 1.15 | 2.88 | 116.9 | 0.55 |
| - | - | - | - | - | - |
| Primaloft Gold 1 | 26 | 0.83 | 2.42 | 46.8 | 0.22 |
| Primaloft Gold 2 | 22 | 0.84 | 2.48 | 93.6 | 0.44 |
| Primaloft Gold 3 | 24 | 0.84 | 2.32 | 140 | 0.66 |
| Primaloft Gold 4 | 33 | 0.79 | 2.82 | 187.2 | 0.88 |
| Average 1,2,3 | 24 | 0.84 | 2.41 | 93.47 | 0.44 |
Table 2: As found and Measured R-value Data for 9 Compression Tests
| Insulation | As Found R-Value | Test 1 R-Value | Test 2 R-Value | Test 3 R-Value | Test 4 R-Value | Test 5 R-Value | Test 6 R-Value | Test 7 R-Value | Test 8 R-Value | Test 9 R-Value |
|---|---|---|---|---|---|---|---|---|---|---|
| Apex 1 | 2.84 | 2.94 | 2.86 | 2.72 | 2.41 | 2.77 | 2.59 | 2.42 | 2.55 | 2.64 |
| Apex 2 | 2.87 | 2.95 | 2.68 | 2.48 | 2.6 | 2.87 | 2.53 | 2.67 | 2.47 | 2.64 |
| Apex 3 | 2.98 | 2.95 | 2.51 | 2.72 | 2.72 | 2.63 | 2.54 | 2.48 | 2.65 | 2.57 |
| Apex 4 | 2.81 | 2.93 | 2.52 | 2.62 | 2.75 | 2.5 | 2.63 | 2.46 | 2.59 | 2.6 |
| Average | 2.88 | 2.94 | 2.64 | 2.64 | 2.62 | 2.69 | 2.57 | 2.51 | 2.57 | 2.61 |
| - | - | - | - | - | - | - | - | - | - | - |
| Primaloft Gold 1 | 2.42 | 2.13 | 2.08 | 2.19 | 2.4 | 2.31 | 2.17 | 2.23 | 2.36 | 2.34 |
| Primaloft Gold 2 | 2.48 | 2.19 | 2.03 | 1.96 | 2.2 | 2.17 | 2.12 | 2.09 | 1.98 | 2.15 |
| Primaloft Gold 3 | 2.32 | 2.13 | 2.03 | 2.03 | 2.31 | 2.11 | 2.12 | 2.28 | 2.07 | 2.21 |
| Primaloft Gold 4 | 2.82 | 2.67 | 2.72 | 2.55 | 2.69 | 2.49 | 2.6 | 2.74 | 2.8 | 2.97 |
| Average 1,2,3 | 2.41 | 2.15 | 2.05 | 2.06 | 2.3 | 2.2 | 2.14 | 2.2 | 2.14 | 2.23 |
Table 3: As Found and Measured Loft Data for 9 Compression Tests
| Insulation | As Found Loft | Test 1 Loft | Test 2 Loft | Test 3 Loft | Test 4 Loft | Test 5 Loft | Test 6 Loft | Test 7 Loft | Test 8 Loft | Test 9 Loft |
|---|---|---|---|---|---|---|---|---|---|---|
| all values in units of inches | - | - | - | - | - | - | - | - | - | - |
| Apex 1 | 1.15 | 1.09 | 1.06 | 0.97 | 1.06 | 1.06 | 1.04 | 1.02 | 0.98 | 0.99 |
| Apex 2 | 1.14 | 1.06 | 1.01 | 0.96 | 0.99 | 1 | 0.97 | 0.98 | 0.94 | 0.97 |
| Apex 3 | 1.16 | 1.07 | 1.04 | 0.98 | 1 | 1.01 | 1 | 0.99 | 0.94 | 0.95 |
| Apex 4 | 1.16 | 1.08 | 1.07 | 0.97 | 1.02 | 0.99 | 0.97 | 0.98 | 0.97 | 0.97 |
| Average | 1.15 | 1.08 | 1.05 | 0.97 | 1.02 | 1.02 | 1 | 0.99 | 0.96 | 1.01 |
| - | - | - | - | - | - | - | - | - | - | - |
| Primaloft Gold 1 | 0.83 | 0.77 | 0.67 | 0.71 | 0.75 | 0.74 | 0.76 | 0.76 | 0.67 | 0.69 |
| Primaloft Gold 2 | 0.84 | 0.68 | 0.7 | 0.63 | 0.69 | 0.64 | 0.67 | 0.7 | 0.68 | 0.66 |
| Primaloft Gold 3 | 0.84 | 0.7 | 0.69 | 0.64 | 0.7 | 0.62 | 0.68 | 0.7 | 0.62 | 0.61 |
| Primaloft Gold 4 | 0.79 | 0.75 | 0.78 | 0.77 | 0.81 | 0.79 | 0.82 | 0.81 | 0.76 | 0.76 |
| Average 1,2,3 | 0.84 | 0.72 | 0.69 | 0.66 | 0.71 | 0.67 | 0.73 | 0.74 | 0.68 | 0.68 |
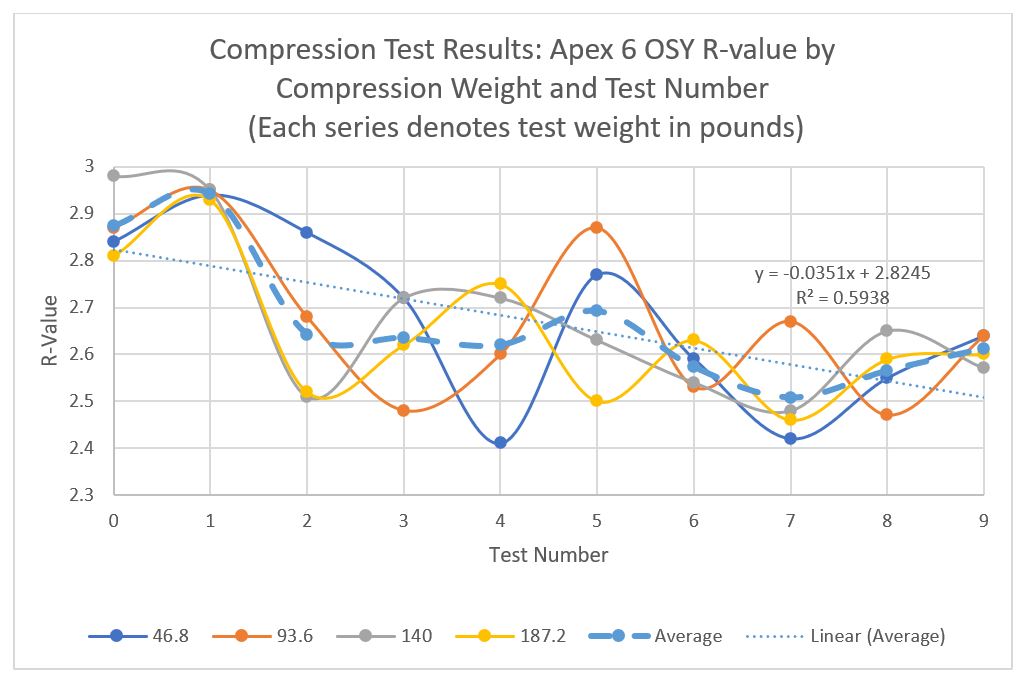
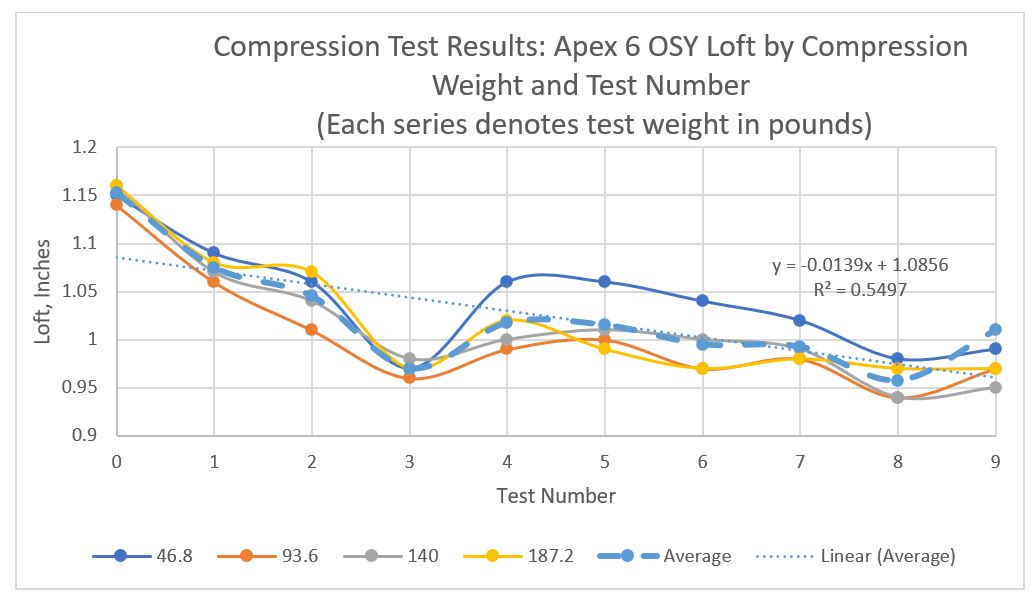
Figures 2 and 3 show graphical results of the R-value data and Loft data for Apex.
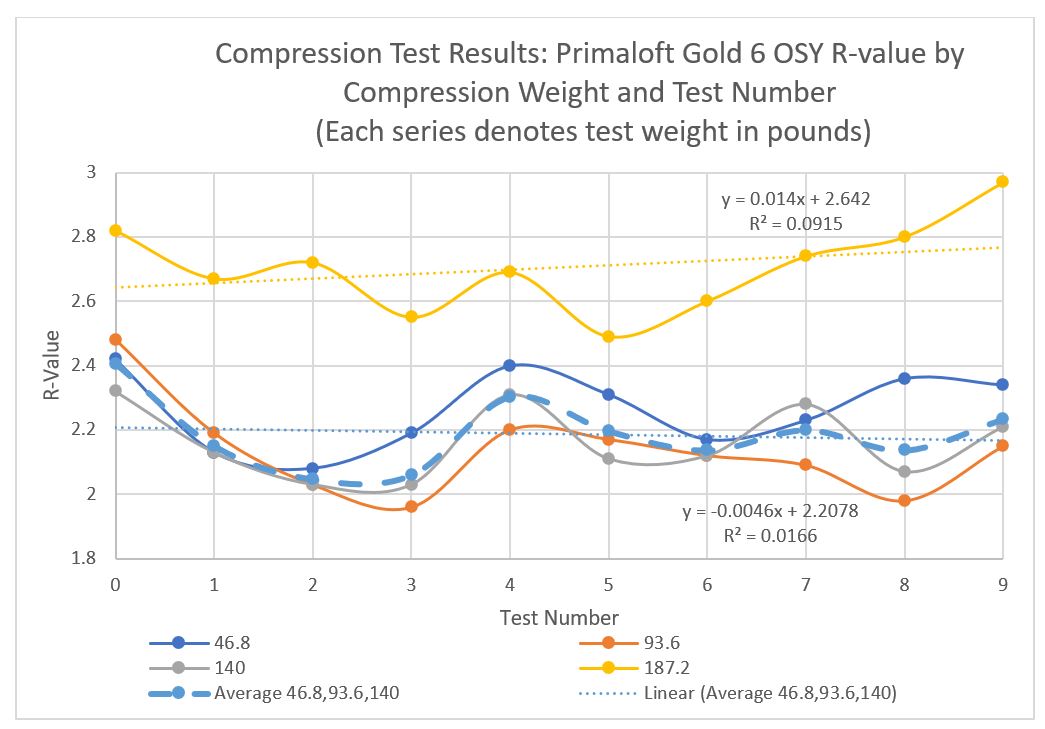
Figures 4 and 5 show graphical results of the R-value data and Loft data for Primaloft Gold.

Discussion of Results
The test results may be most easily understood through the graphical data presented in Figures 2-5.
On each graph, test 0 is the as found value for R-value or loft.
Each graph contains multi-colored plots. Each plot corresponds to the pressure applied to the insulation sample. There is a dashed line which is the plot of averages.
Originally, I expected that both the R-value and loft would degrade more rapidly for the more heavily weighted samples. In fact, observation of the plots shows no evidence of this. If this had occurred, the plot for the 187-pound plot would show consistently lower values and steeper decline than the 47-pound plot. This type of divergence is not present. So, we can conclude that the compression weight does not increase the rate of insulation degradation. It may matter for compression values lower or higher than the pressure range that was tested. It appears that degradation, to the extent it occurs, is simply a function of the number of compressions.
The changes in R-values show no specific response pattern to compression. We can see R-values both rise and fall for each compression series and there is no consistent pattern for this. It seems that the best way to discern any underlying pattern is to calculate the average value for the four samples included in each compression cycle. We can then look for a strong trend in the average behavior.
The blue dashed line is the average for each of the samples by test number. It is not a smooth curve. Each graph contains a simple linear curve fit of the average data. This is denoted by a dotted line. At the right end of each dotted line, we can see the curve fit equation and the coefficient of determination (R2) for the best-fit curve. We can look at the linear curve fit data to get two pieces of information:
- How good is the curve fit for predicting R-value or loft as a function of the number compressions?
- How much can we expect R-value or loft to fall (or rise) as a function of the number of compressions?
In terms of the quality of predictive value, we simply can look at the R2 value for each plot. In terms of how sharply degradation might be occurring, we can look at the straight-line curve fit equation. In particular, the slope of the line is provided by the first term of the line fit equation. If a negative sign is present, the line will slope down and the R-value will decline with more compressions. The larger the slope number, the greater will be the rate of change with each compression cycle.
The R2 values for the Apex plots are moderately high (indicating a data trend that may be statistically predictable) at over 0.5 for both R-value and loft. The slope of both equations is negative, meaning that R-value and loft are decreasing with the number of tests. R-value decreases by almost 0.04 for each compression cycle. The loft decreases by about 0.01 inches (0.025 cm) per compression cycle. This consistent degradation is contrary to my expectations. I expected that Apex, being continuous filament insulation, would not show continuous degradation with compression. My expectations are not supported by the test results.
For the Primaloft Gold graphs, we find two curve fit equations on each. The yellow dotted plot corresponds to Sample 4. The blue dotted plot corresponds to the average of samples 1, 2 and 3. We can see that the R-value for sample 4 is consistently higher than R-values for samples 1, 2, and 3. During the course of testing, I ran out of Primaloft Gold insulation. I had enough for three test samples. These are samples 1, 2, and 3. I obtained the 4th sample from insulation I purchased in the middle of 2020. This sample has a consistently higher R-value than samples 1, 2, and 3. It also weighs more than samples 1, 2, and 3. The performance of sample 4 is clearly different than that of the other samples. Thus, sample 4 has its own trend line and the average of samples 1, 2, and 3 are used to produce the second trend line.
The R2 values for Primaloft Gold are extremely weak for both trend lines. The low R2 indicates that repeated compression has little or no impact on R-value or loss of loft for Primaloft Gold. The curve fit equations for samples 1, 2, and 3 show little to no degradation in R-value or loft. In the case of sample 4 R-value, an increase in R-value is found as testing continues. The lack of thermal degradation of Primaloft Gold is also contrary to my expectations.
In all of these plots, the use of a straight-line curve fit is misleading. This suggests that at some number of compressions, the insulation will have no thermal insulation value and no loft. This, of course, will not happen. The degradation of these insulations, if occurring, should level out at some point. The use of a polynomial curve fit can reflect such behavior and it does increase the R2 values somewhat. However, polynomial curves actually start to trend upward for R-values in these plots, suggesting that repeated compression cycles will ultimately result in higher thermal performance! This outcome seems unlikely in the long run. Unfortunately, we don’t really know what the longer-term outcome looks like based on only nine compression cycles.
Conclusions
It is obvious that not enough compression cycles were conducted here to get a better understanding of long-term synthetic insulation behavior. I intend to continue this study, but with a somewhat different approach. In the next round of testing, I will continue with only samples 1 and 3 for each type of insulation. I will compress and then permit relaxation for two cycles for the two insulations and then measure thermal resistance and loft. This will dramatically speed up the testing process and reduce the labor requirement. It will still take considerable time, so expect another installment on this subject after at least a couple of months.
These tests revealed that R-value can rise as well as decrease as a result of compression. This is another unexpected outcome of this test. What appears to be happening is that loft recovery is inconsistent, and the air entrapment characteristics of the insulation actually change. At times, it appears to actually increase air entrapment and at others, air entrapment decreases, and the R-value is reduced. I suspect that the bonding of fibers within the insulation may be failing as a result of compression. This permits the spacing between fibers or layers of fibers to increase, thereby trapping more air. This is not something I can prove through physical or microscopic inspection. As I experience a greater number of compression cycles, the nature of the physical response to compression may become clearer.
Finally, the compression method used here does not quite replicate the act of stuffing a sleeping bag or garment into a stuff sack. In these tests, compression simply removed the air from the insulation sample. Fibers were crushed down to the ground in a mostly vertical direction. The fibers were not subject to bending forces. Bending forces might diminish the fiber crimps that provide the spring to re-loft after being crushed. Certainly, fibers are bent or torqued when inserting a garment or sleeping bag into a stuff sack. So, in future tests, I will try to come up with a more aggressive test setup that will involve bending fibers past 90°. This will better replicate what happens when using a stuff sack for storing your gear.
For now, I still cannot conclude that severe degradation of synthetic insulation will occur with normal use. However, as was the case in the last article on this subject, when stuffing your garments or sleeping bags, use minimal force. If possible, try rolling the garment or sleeping bag instead of engaging in random and forceful stuffing. The only prize you get for achieving the smallest stuff sack dimensions may be a ruined garment or sleeping bag.
Related Content
- more in this series by Stephen Seeber
- listen to our synthetic insulation podcast
- research and discover synthetic insulation-based gear in our Gear Shop
DISCLOSURE (Updated April 9, 2024)
- Backpacking Light does not accept compensation or donated/discounted products in exchange for product mentions or placements in editorial coverage. Some (but not all) of the links in this review may be affiliate links. If you click on one of these links and visit one of our affiliate partners (usually a retailer site), and subsequently place an order with that retailer, we receive a commission on your entire order, which varies between 3% and 15% of the purchase price. Affiliate commissions represent less than 15% of Backpacking Light's gross revenue. More than 70% of our revenue comes from Membership Fees. So if you'd really like to support our work, don't buy gear you don't need - support our consumer advocacy work and become a Member instead. Learn more about affiliate commissions, influencer marketing, and our consumer advocacy work by reading our article Stop wasting money on gear.

Discussion
Become a member to post in the forums.
Companion forum thread to: By the Numbers: Crushing It – How Bad is Thermal Degradation in Synthetic Insulation?
In part two of this investigation, we see what happens when you crush insulation beneath a stack of concrete pavers – again and again.
Interesting test.
I wonder if the following technique may more closely approximate putting into a stuff sack:
Drop garment or sample under test into a lexan/plexiglass tube or hollow cylinder. The diameter of the tube would be chosen to approximate the amount of folding, crumpling, and/or “squashing” that happens when one shoves a bunch of clothes into a compression stuff sack and then tightens down the webbing straps to form a dense “ball” that a backpacker typically drops into their backpack.
Use a piston with a round plate having the same diameter as the inner diameter of the tube to “squash” the test piece to a specified force, then raise the piston. The compress and release times per cycle, and number of cycles are TBD.
Hi Jeff:
Thanks for reading. I am now doing a second round of testing on the same samples, as described in the article. After that, I expect to do a 3rd round of testing along the lines you suggest.
Excellent article! I agree that the “bending forces” caused by stuffing synthetics into small stuff sacks causes additional degradation to synthetic insulation fibers. The bending forces tend to break the fibers, especially older fibers, and that reduces the loft and probably air entrapment. I have some 40 to 50 year old synthetics that have never been stuffed that still have good loft.
The US Army Nautick Labs tests also agree with these tests. That’s why theArmy chose Climashield.
Hi Stephen
Real Testing: wonderful stuff. Thank you.
But I would like to query two figures in this quote from the article:
Based on these sources, I assumed an average weight of 202 pounds (92 kg) and an average skin surface of about 25 square feet (2.3 square meters).
An average American male weighs 202 lb? That is 50% heavier than me. Are all walkers this heavy? I do wonder. Perhaps that figure includes a large number of couch potatoes?
I do not think it is of much use quoting the average skin surface of about 25 square feet as that is for the whole skin surface: front, back and sides, all around arms and legs. That is far more than the frontal cross-section, which is closer to what rests on a sleeping bag when we sleep. Even so, those concrete slabs sure flattened the stuff.
I wonder whether a lot of the degradation might come from ‘grinding’ the stuff: moving around on it while lying on it. Or from having a pack squash it against your back. Testing that might be difficult.
Your observation that the performance of these synthetics has improved is much appreciated. I know they started off rather poor, but that was 20 – 30 years ago. Have you asked the companies about this? It might be interesting to see if you could get a reply from the TECHNICAL people (NOT the marketing arm).
Cheers
Hi Roger:
I share your concern about the average male data, as well as the simple method I used to calculate the pressure to use. I am guessing that most people who go backpacking weigh less than the average US male. Clearly, my approach is an over simplification, but I needed some frame of reference to proceed from. I can think of reasons why my number could be too low or too high. However, since I tested with 1x to 4x that weight, I think the results are still reasonable.
I did not use the 25 square foot figure. I used less than half of that (10 square feet) for skin surface.
I am now continuing the test along the lines described at the end of the paper. I would not be surprised after another 9 or 12 crushes, nothing will change. Next, I will use a different approach that will cause the fibers to bend as they would when stuffed. I am afraid I can’t test “grinding”, but hopefully, the 3rd round of testing will shine some greater light on the subject.
I can’t help wonder if the salts and oils that ooze out of a person in a sleeping bag impact the resilience of synthetic insulation. I have an old Arcteryx Atom AR Hoody. I cut it open so I could observe the Coreloft insulation within. What I found was a solid mass. Kind of looks like crumpled paper that you pull from your pocket after it goes through the washer and dryer. I only use that jacket around town when it is not cold, so it works for that. Even if this could be a mechanism, who knows how the industry might have changed the chemicals applied to the polyester to prevent such deterioration.
What I do know is that every time I pull the insulation samples from the pavers, they seem to get fully puffed up in a few minutes and I have to admit, I am impressed with what seems to be a successful manipulation of the properties of polyester fibers.
My experience in trying to contact these companies is that they don’t respond. I have been unable to even find anyone at Primaloft or Climashield with whom to discuss my findings. If anyone has any contacts in those companies, please PM me and I will see if they will talk to me.
since I tested with 1x to 4x that weight, I think the results are still reasonable.
Reckon!
But I suspect using a figure of 5 squ feet might be closer to reality. 2 sqft for torso, 2 sqft for both legs, 1 sqft for arms – which often are not even on the material.
We (Sue & I) have some BPL Cocoon jackets from at least 14 years ago. They are still fairly good. They are stored between trips on coat hangers. OK, I have been considering replacing them with something using a modern synthetic, but I have not yet done so.
Cheers
Stephen, does washing a synth item in a front load machine, air dry, then air cycle with tennis balls make an appreciable difference? My less-than-10 year old synths are holding up fairly well, i.e. Arc Teryx and OR. Older stuff, Marmot, not so well. I won’t go into sleeping bags as my synth is 20 yrs old and lost loft long ago. I only use synth bags in 50+F temps.
Hi Bill:
I discussed washing here. In that article I provided a link to Wiggy’s, which has a good discussion of washing synthetics. Check it out.
Just my opinion, but I would not tumble a synthetic bag or garment with tennis balls. The purpose of the tennis balls is to break up clumps of down that formed when washing. There’s no need to do this with a synthetic bag, especially not a bag that uses mats of long fibers like Climashield Apex. The tennis balls will just hammer on the synthetic fibers, causing them to degrade quicker. I’ve made three Apex quilts and I never dry them with tennis balls.
If possible, try rolling the garment or sleeping bag instead of engaging in random and forceful stuffing.
Is this advice applicable to all types of synthetic insulation? I have been looking for advice on packing synthetic quilts, and most links seem to lead to advice to stuff it. I am genuinely interested how insulation type relates to stuff-or-roll debate.
or, maybe it doesn’t make that much difference whether you stuff or roll, just don’t do it forcefully
Hi Niko and Jerry: That statement was made at the time because I was surprised with the minor degradation I had found and felt that just vertical crushing was not sufficiently abusive. So-just a guess. I am still plodding along with this so I hope to come up with some insights over time. However, Jerry’s advice to avoid force whether rolling or stuffing, is probably spot on.
Did you make an effort to characterize your measurement uncertainty? It might be a good idea to have a control group (uncompressed insulation) that is measured every time you measure after a compression cycle. That will give you some sense of your measurement uncertainty as well as variables beyond your control (changes in humidity/temperature/measurement device).
Hi Ben: Good question. The greatest source of uncertainty in this test is largely the manner in which re-lofting occurs. I think the dimensions of air spaces in the samples change from crush to crush, thereby causing the changes in the thermal resistance. I cannot prove this. When I started, the variation from test to test surprised me so I did a complete calibration of the hot plate and then improved my environmental controls. Then, I threw out the results of 10 compression cycles and started all over again. Of course, as the data shows, there was still significant variation from test to test and the issue is likely in the relofting, not the instrumentation. Another source of uncertainty is the uniformity of sample placement on the guarded hot plate to avoid producing air spaces between the insulation and plate surface. With thin test samples, I can view them with the thermal imager and see where extra air spaces are located. That technique does not work on thick, non-uniform high loft insulation. Environmental conditions are very closely controlled. Ambient temperature variation is typically +/- .5 F. Humidity is pretty constant and is largely irrelevant for this test. My NI thermocouple/USB converters are subject to some cold junction drift. I check these against parallel thermocouples that are read directly by an external meter at the beginning of each sample hot plate test. I then adjust adjust an offset in my control program to ensure the data on the computer screen matches the readings on the meter. I also check and readjust periodically as the test runs to ensure that drift is not occurring. These kinds of issues will not be mitigated by retesting an uncompressed sample. Random variations in the test results should fall out through curve fitting of the data. I also try to ensure reliability by rerunning results that appear unexpected. In general, I have good replication on those instances. My expected variance for the hot plate is +/-3% or so. I just completed the 17th crush and will continue along and let the statistics find the underlying trends. Thanks for reading and posting.
FWIIW: testing sleeping bags to the EN standard has similar problems.
But then, how your SB or quilt will behave in the field also has such variations.
You can’t win!
Cheers
“I assumed an average weight of 202 pounds… Perhaps that figure includes a large number of couch potatoes?”
Heyyyy… I was getting up to that weight and doing as much mileage as I’ve ever done. Recently, I’ve lost a bit of weight though.
25 square feet? 2 square feet? I sleep on my side, maybe 3/4 of my weight on the area between hips and shoulders. I just measured with ruler – 4 inches x 2 feet – 0.7 square feet. That would be equivalent to my full weight over about 1 square foot.
But I like your test as you’re doing it. You can always come up with ways to do it differently.
I suspect that aggressively stuffing it is where most of the damage is done, not sleeping on it. If you sleep in a sleeping bag, and the part underneath you gets compressed it doesn’t really matter anyway, it will get compressed to almost nothing when you put your weight on it. And there’s a sleeping pad to provide insulation.
This is really interesting stuff!
One other thing I think nooone has brought up is the effect garment construction will have on longevity of an insulation. Currently here you are testing the insulation in their raw, sheet form – but as we know most of the time Primaloft Gold does not end up used inside a garment in this way. I suspect you are right in considering the bending forces (or shearing, tearing, etc) may play a bigger role than just compression (especially given what we know about doing a simple tear test on Climashield vs Primaloft for example). However given that Primaloft is often quilted (or always quilted) I wonder if those smaller individual pieces behave differently or react differently to different types of compression (different angles for example – maybe they do worse when compressed along their fiber orientation?)
An interesting test would be to sew up a simple square “jacket replica” piece using different insulation and different constructions to try to mimic what an actual real world jacket might go through and then compare how they each react with compression – for example you could get some scrap nylon fabric for the face / inside face and then sew in a sheet of climashield just like most jacket manufacturers do and you could also make one with climashield cut up and quilted similar to how primaloft garments often are. The same could be done to make a square jacket “replica” with primaloft in both quitled / unquilted and then both could be subjected to various types of compression / bending / etc.
The effects of body oils and environmental contaminants definitely could also be playing a big role here – seems like this might be much harder to test however – although I suppose an easy one might be to leave each insulation soaked in water for a period of time (maybe 24 hours) and then see what kind of effects it had once the insulation was dried. The same could be done with some type of simple oil (or diluted oil) . It might also be worth testing compression / bending / shearing forces on the insulation WHILE it is fully soaked.
Plumafill remains an interesting one to me simply in that it seems to be very unique in its basic structure – instead of sheets (or loose insulation) it comes in actual long strands with fluffy polyester fibers coming out of those strands. Just from a construction point of view this seems like it could open up some unique possibilities (or challenges as well) and if I had to guess I would maybe surmise that it would do very well with bending forces given that the base “strand” is likely decently durable. Patagonia seems to have figured out a way to use it without quilting (see the new “Thermal Airshed” jacket) which to me seems like a much more efficient method vs something like the new Micro/Macropuff jackets with lots of sewn through areas.
The insulation that also really intrigued me was the very hyped jacket before the Micro/Macro which used “the HyperDAS” branded insulation – in practice these jackets ended up not being very popular because the insulation itself was quite stiff – however I was never able to find out who was making the insulation, what the CLO was, or any specific info. It seems to hold up very well however in terms of loss of loft in garments I have seen that were very heavily used. At the time I considered it was just climashield rebranded but looking back I think it must have been something different and much more dense to achieve that type of stiffness. Never understood why they bothered to quilt those jackets at all – I am guessing it was mainly just a stylistic choice.
Hi Christopher:
As Jerry said above, you can always come up with ways to do it differently. However, I have to do the test in a manner that is systematic and, hopefully, has a predictive value to it so I can draw some conclusions about the failure mechanism. So, start simple. Use mechanisms that can be controlled and support quantitative methods that lend themselves to developing insight into the underlying behaviors.
Here is what we don’t know: 1) Whether failure of modern insulation actually occurs. People claim their insulation looses resilience with use. And this manifests as reduced loft. I can tell you this is hard to measure for bare insulation in a well controlled experiment. Unless severe failure occurs, I cannot imagine seeing this in an assembled garment or sleeping bag. Possibly this occurred 20 or 30 years ago. I can only test what is available to me now. From what I have seen here, so far, the insulation always puffs back up and the loss loft over numerous crushes is very small and not something you could perceive in a finished garment unless you worked hard to accurately measure loft with precision as the garment aged. This is something I would guess few have done. 2) We don’t know if insulation fails from compression pressure, compression cycles or bending. From this test, we are learning that compression cycles seems more important than compression load. Of course, at some level, load will matter. But extreme loads seem to have no greater impact on degradation than reasonable load. As I have already stated, if my compression testing does not result in failure, then I will go on to study the impact of bending forces. For that test, I may have to create new pillows because if this insulation is bent onto itself, the fibers will become entangled with one another and getting the sample flat to test on the hot plate will probably damage the insulation structure. I will worry about that when I get there.
Before I started, I considered several approaches, including the one you suggested. However, I decided to start this test with force in a single direction-vertical. Simple to do. Easy to measure on the hot plate. Inexpensive to provide test samples. I would see two things: whether force in a single direction produced insulation failure and whether failure might be the result of magnitude of force or repeated force. I don’t believe quilting would impact this type of failure mechanism. The insulation is free to be crushed and free to return to original form regardless of quilting. The stitched insulation areas are not free to change in response to the crush cycles but the non-quilted areas area. The quilting is designed to keep the insulation in place and minimize lateral forces that would tend to pull the insulation apart. They do not control vertical forces. I could be wrong about this, but I will continue with the logic that brought me to this route.
Concerning oils or water being destructive. I don’t think water is destructive. I completed the washing/drying tests and this had little impact on insulation performance. The test was done using constructed pillows, done in the manner you suggested above. Skin oils? Maybe. Don’t know. I have not actually seen anything about this in the literature. Perhaps you can try a literature search for any discussions of this as a failure mechanism.
Plumafill? I cannot test what I cannot purchase. If you want to donate some Micro Puffs, I will be happy to try to destroy them. There are many insulations around and I have to start somewhere. I started with insulations that are both market leaders, that are available for purchase and affordable to purchase. Concerning the thermal airshed: Without cutting the jacket open, we cannot know how the insulation is held in place. We don’t even know if this insulation is the same as what is in the Micro or Macro Puffs. I suspect Patagonia can all anything Plumafill just like Arcteryx calls all their various insulations Coreloft.
This is turning into a much more complex experiment than I originally envisioned. That is fine. Right now, it is telling me that the widely held assumption that synthetic insulation fails with use may not be right for today’s insulation products. The only way to know is to systematically plod on and let the accumulation of data tell the story. So now, I have completed the 18th crush and will measure R values tomorrow and start the next round of crushing. I expect to go to 21 and then see where the statistics send me.
it is telling me that the widely held assumption that synthetic insulation fails with use may not be right for today’s insulation products. The only way to know is to systematically plod on and let the accumulation of data tell the story.
My praise to Stephen for having the patience to do this work. And for publishing it here!
Cheers
https://fablesofaesop.com/the-miller-his-son-and-their-ass.html
a man takes his donkey to market with his son
a passerby tells him he’s mistreating his son so he has his son ride the donkey
someone else says no, that’s not how to do it, he should ride the donkey so he does that
etc. etc….
someone else says he should carry the donkey with his son so he does that
they accidentally drop the donkey over the bridge and the donkey dies
“By trying to please everybody, he had pleased nobody, and lost his Ass besides.”
This is applicable to so many cases
Certainly I was not implying that your testing methods are not where someone should have started – the opposite in fact – its definitely great to see a test with targeted parameters that really give us insight into a specific hypothesis!
I do however think that the (while anecdotal) evidence of even some modern synthetic insulation “packing out” is significant enough there must be some other mechanism of degradation – especially given your recent tests. I may just have to buy one of those new Patagonia jackets and seam rip a corner to see what is actually going on inside.
I also cannot help but wonder if the ideal synthetic garment might actually be a combination of multiple of these insulation types – will definitely be good to see what your next results show!
Very nice to see someone address this issue in a scientific manner. I look forward to your next article on this subject!
Become a member to post in the forums.