Introduction
For many hikers, backpacking trips are long enough to require the recharging of smartphones, earbuds, and other electronic devices between town stops. Recharging on the trail requires a portable battery charger (PBC).
Previously, we have reported on the shortcomings of PBCs, including the measured deliverable energy density that was less than what the manufacturer specified. In addition, a recent Backpacking Light Member Q&A presented other challenges related to managing rechargeable electronic devices and portable battery chargers.
These limitations highlight the need to understand the actual performance of PBCs in the types of conditions experienced by backcountry users. Unfortunately, very little of this type of information exists. Furthermore, most reviews of PBCs online, especially in the context of backcountry travel, present poorly validated claims. In addition, review authors generally lack experience or understanding of how electronic device batteries and recharging work.
Thus, this report presents BatteryBench and other test results of four high-energy-density PBCs.
(Note: PBCs are also known as battery banks, battery packs, portable chargers, portable power devices, power banks, or power packs. These terms may be used interchangeably in this report.)
“A watt-hour here, a watt-hour there, and pretty soon you’re talking real energy.” – Not said by Senator Everett M. Dirksen
Table of Contents
- Methods
- Testing criteria
- Final PBC candidates
- Final tested PBCs
- Solar Recharging test
- BatteryBench test results and analysis
- Specified vs. consumed vs. delivered energy
- Evaluating the performance-to-weight ratio of PBCs
- Evaluating overnight device charging performance of PBCs
- Evaluating cold performance of PBCs
- Evaluating USB-C and USB-A power of PBCs
- Evaluating recharge time of PBCs
- Recommendations
- Highest delivered energy density
- Highest performance
- Selection advice
- Conclusion
Methods
What were the testing criteria used to evaluate the performance of PBCs?
Each charger was evaluated based on several criteria to help the reader discover the best portable battery charger for their needs:
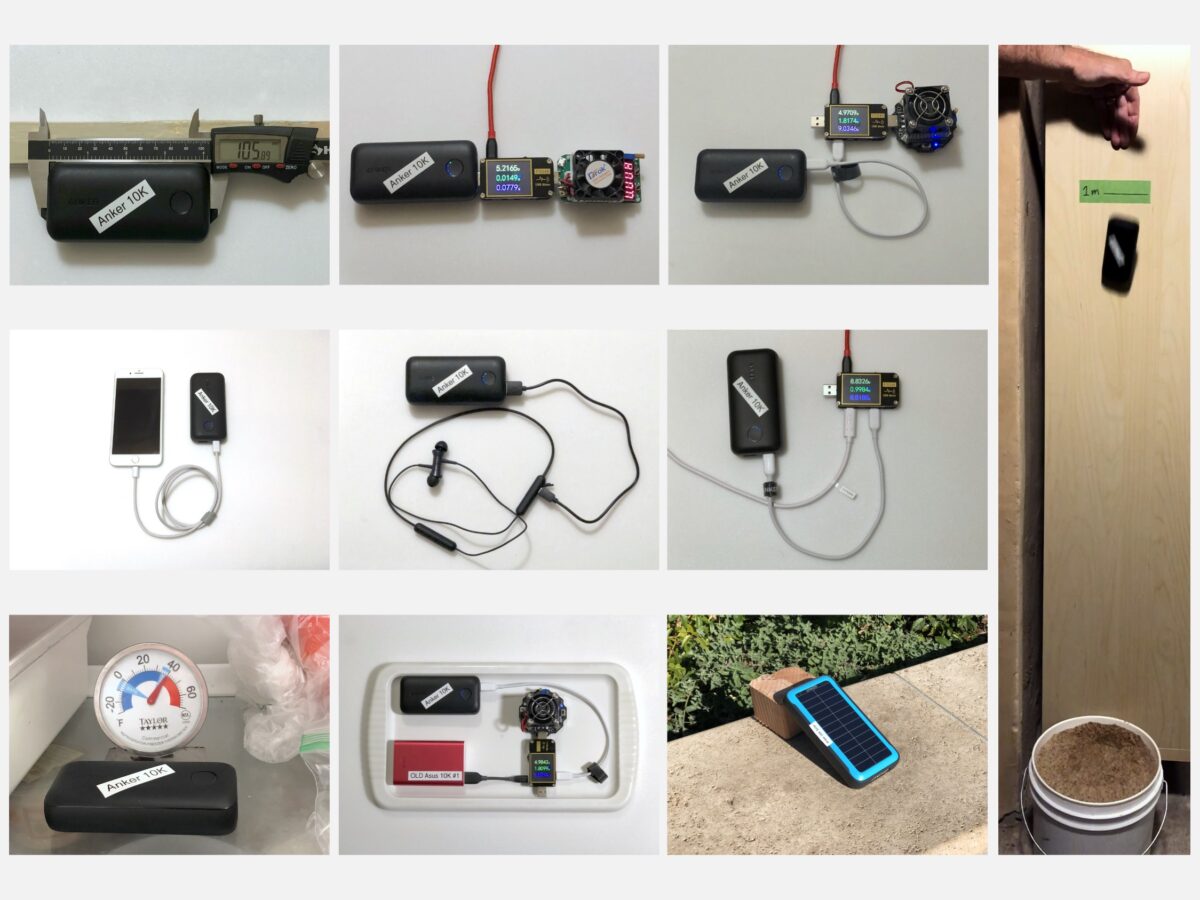
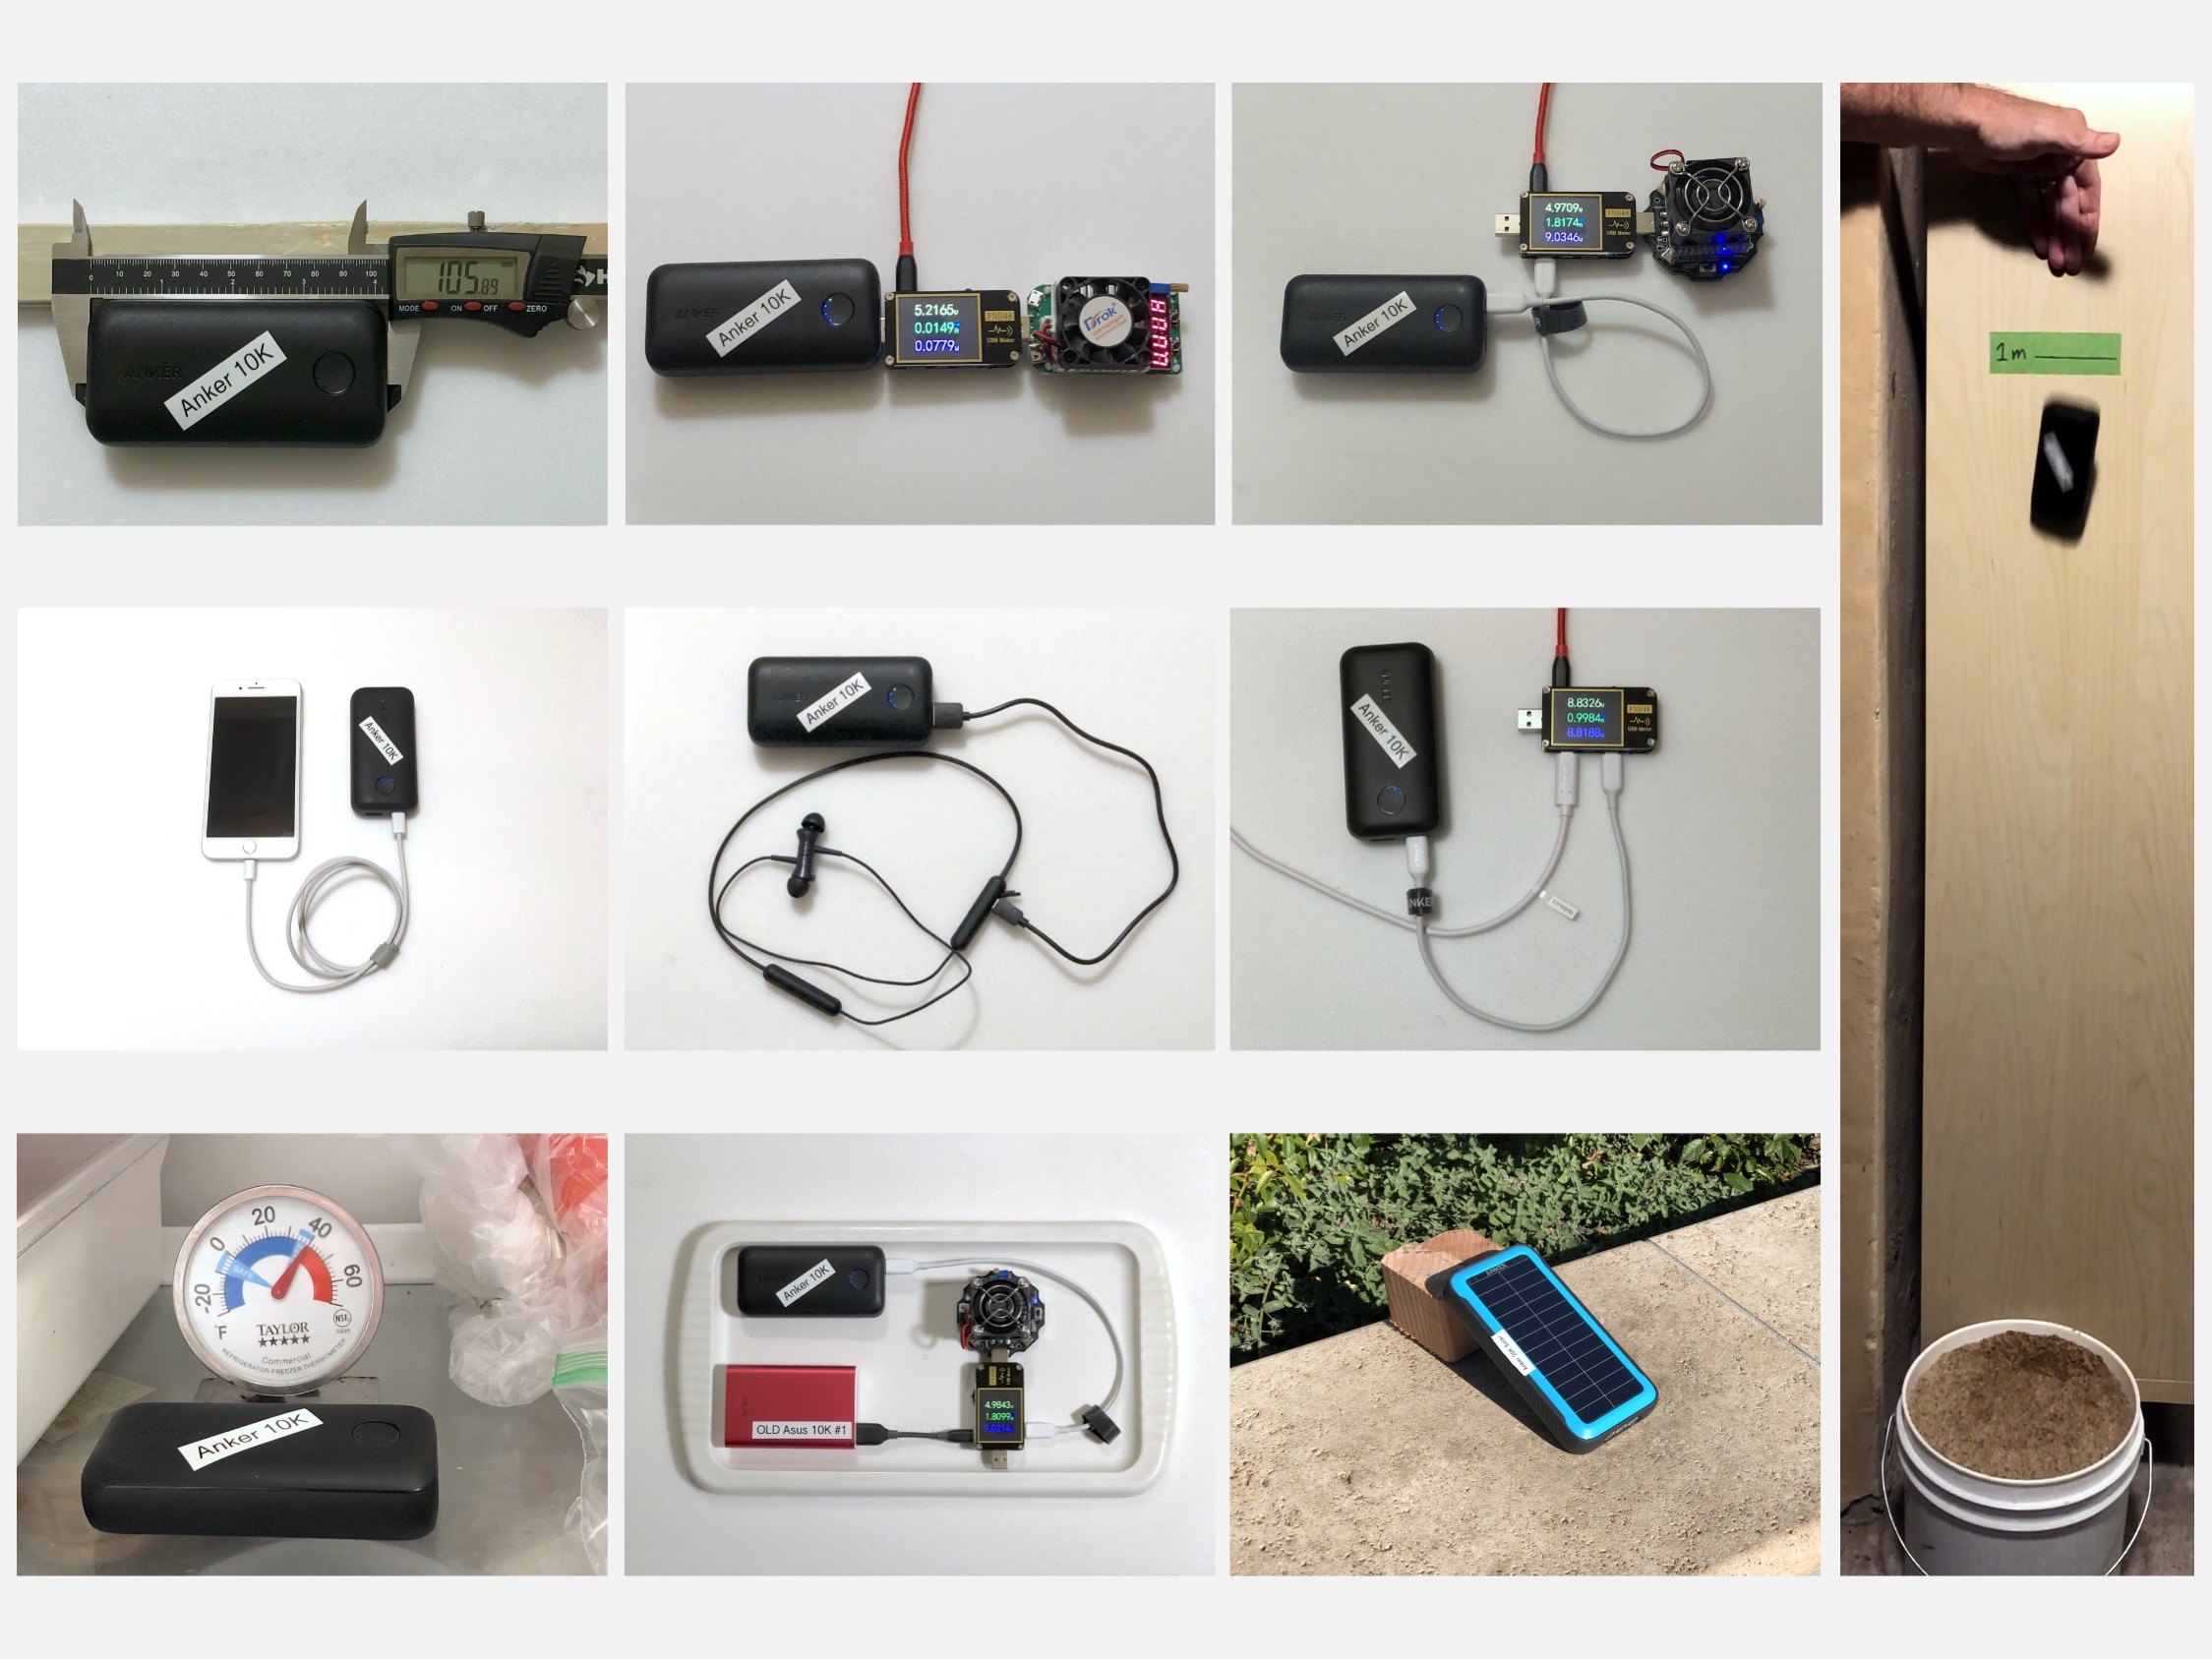
- Physical Assessment: PBC weight and dimensions, evaluations of button and light usability, case design, and USB port quality.
- Delivered Energy: How many watt-hours can the PBC supply?
- Smartphone Overnight: How much energy does overnight smartphone-recharging waste?
- Low Power Mode Overnight: How much energy does a low power mode waste overnight (e.g., recharging earbuds)?
- Cold Storage: How much energy does keeping a PBC at low temperatures waste?
- Cold Delivered Energy: How much energy does recharging a device at low temperatures waste?
- USB-A Power: How much power does the PBC USB-A port deliver?
- USB-C Power: Same as USB-A Power, but using USB-C.
- Recharge Time: How long does it take a PBC to recharge from a small, fast AC charger?
- Drop Tests: How much damage does a PBC suffer from a fall?
- Solar Recharging: How quickly can a PBC’s solar cells add energy?
How were these testing criteria evaluated?
BatteryBench contains test details for all these criteria, except for Solar Recharging. The Solar Recharging test is described towards the end of this section.
What selection criteria were used to narrow the PBC market and identify candidates suitable for this study?
Market research reveals dozens of different types of portable battery chargers from too many brands to count. A full round of tests for one PBC takes about 11 days. Therefore, it is essential to narrow the field for the sake of time.
The following features were prioritized to narrow the field of PBCs for testing:
- Must have been made or marketed by an established, reputable brand.
- At least one USB-C port delivering at least 18 W.
- 10,000 mAh and 20,000 mAh class devices.
- The highest specified energy density (Wh/kg) in that brand and class.
Why were these features prioritized?
- It seems like a bad idea to risk damage to smartphones, satellite communicators, and other expensive devices by using PBCs from little-known brands.
- USB-C ports can supply more watts than USB-A for fast recharging, and many PBCs have both. Newer devices needing recharging usually have USB-C.
- Trekkers carrying more electronics, such as larger cameras, need a PBC with more energy (20,000 mAh or more). Thru-hikers and other backpackers commonly carry fewer electronic devices or visit towns more frequently use portable battery chargers in the 10,000 mAh class.
- Calculating specified energy density is one way to find better PBCs.
Finally, since many hikers wonder about solar cells for backpacking, one promising PBC with a built-in solar panel was included in this report.
Based on the selection criteria above, what were the final PBC candidates?
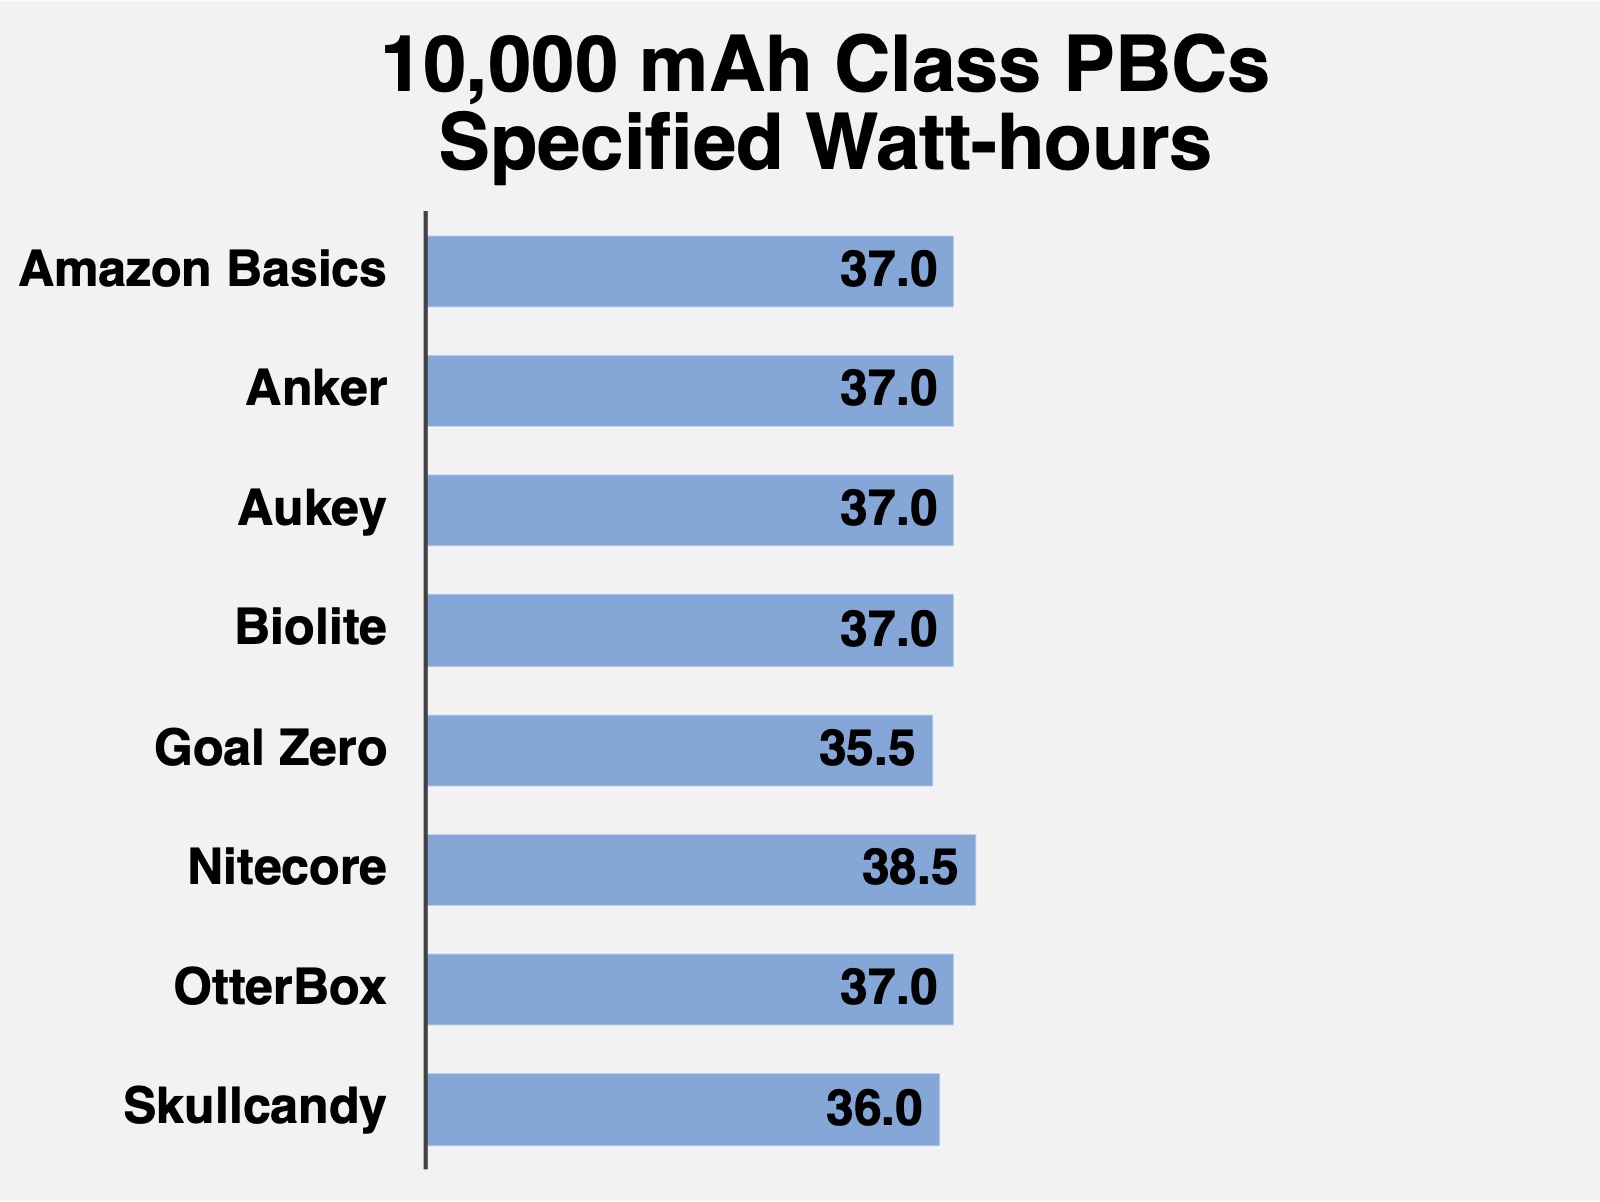
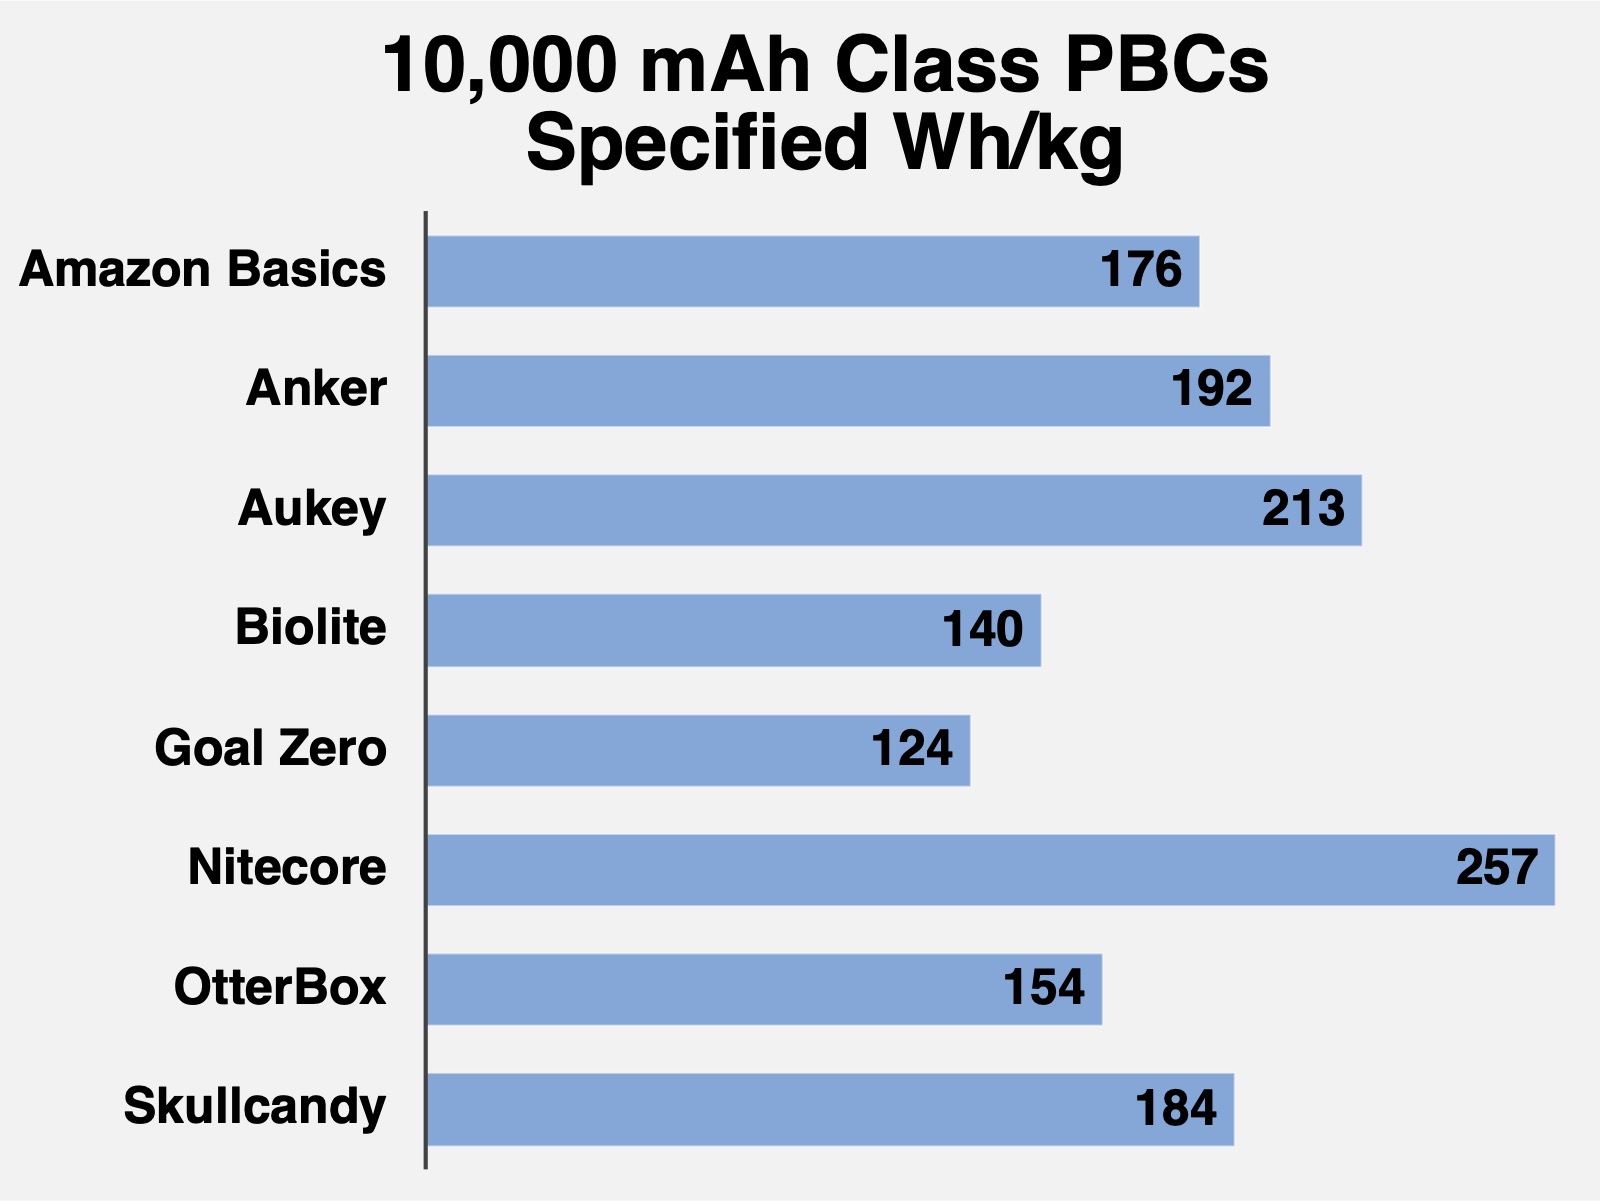
The following tables describe PBCs that meet the previously-stated criteria. Manufacturer specifications (below) were used to compute energy density (Wh/kg). Product availability is shown as of December 2021. Supply-chain issues and rapid product obsolescence are the primary reasons affecting product availability.
Table 1: Potential 10,000 mAh class PBCs
| potential 10,000 mAh class PBCs | Wh | grams | Wh/kg | available |
|---|---|---|---|---|
| Amazon Basics Power Bank 10000 | 37 | 210 | 176 | yes |
| Anker PowerCore 10000 PD Redux | 37 | 193 | 192 | yes |
| Aukey PB-N83 | 37 | 174 | 213 | no |
| Biolite Charge 40 PD | 37 | 265 | 140 | yes |
| Goal Zero Venture 35 | 36 | 287 | 124 | yes |
| Nitecore NB10000 | 39 | 150 | 257 | yes |
| OtterBox Fast Charge Power Bank 10,000 | 37 | 240 | 154 | no |
| Skullcandy Fat Stash Portable Battery Pack | 36 | 196 | 184 | no |
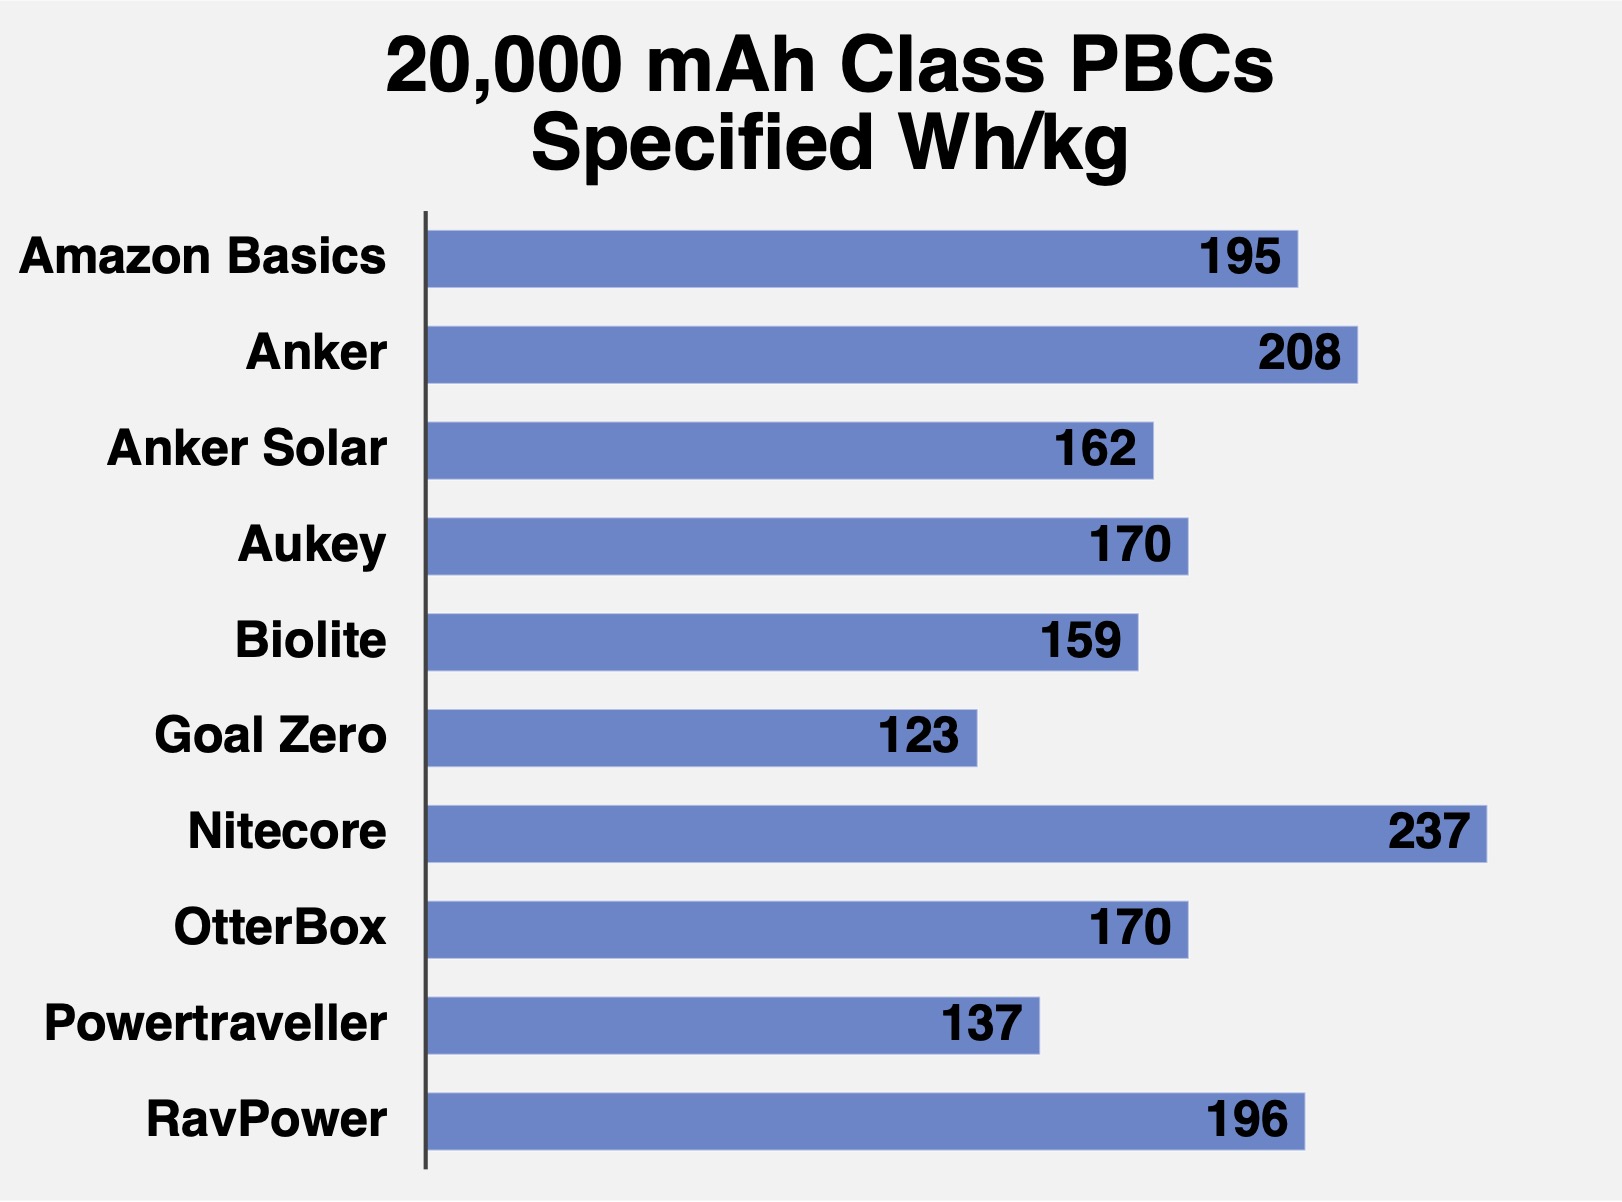
Table 2: Potential 20,000 mAh class PBCs
| potential 20,000 mAh class PBCs | Wh | grams | Wh/kg | available |
|---|---|---|---|---|
| Amazon Basics Power Bank 20100 | 74 | 380 | 195 | no |
| Anker PowerCore 20000 PD | 72 | 346 | 208 | no |
| Anker PowerCore Solar 20000 | 76 | 468 | 162 | no |
| Aukey PB-Y14 | 74 | 435 | 170 | yes |
| Biolite Charge 80 PD | 74 | 465 | 159 | yes |
| Goal Zero Venture 75 | 71 | 577 | 123 | yes |
| Nitecore NB20000 | 77 | 325 | 237 | yes |
| OtterBox Fast Charge Power Bank 20,000 | 74 | 435 | 170 | no |
| Powertraveller Merlin 75PD Power Pack | 74 | 540 | 137 | yes |
| RavPower PD Pioneer 20000 | 73 | 372 | 196 | no |
The following analysis highlights some of the variability in specifications within each PBC class (10,000 mAh vs. 20,000 mAh).
The specified internal battery capacity of 10,000 mAh class PBCs differed by as much as 8%:
In addition, their energy density varied even more – the highest PBC had more than two times the energy density of the lowest. Other features can account for some of this difference:
PBCs in the 20,000 mAh class also had an 8% difference between the highest and lowest specified internal battery capacity:

Once again, energy density almost doubled between the lowest and highest:
Which PBCs were tested in this report?
Since this report presents data acquired over several months of testing in 2021, promising portable battery charger candidates went in and out of stock (and, in some cases, completely vanished). By the time this article is published, some of these PBCs could be unavailable.
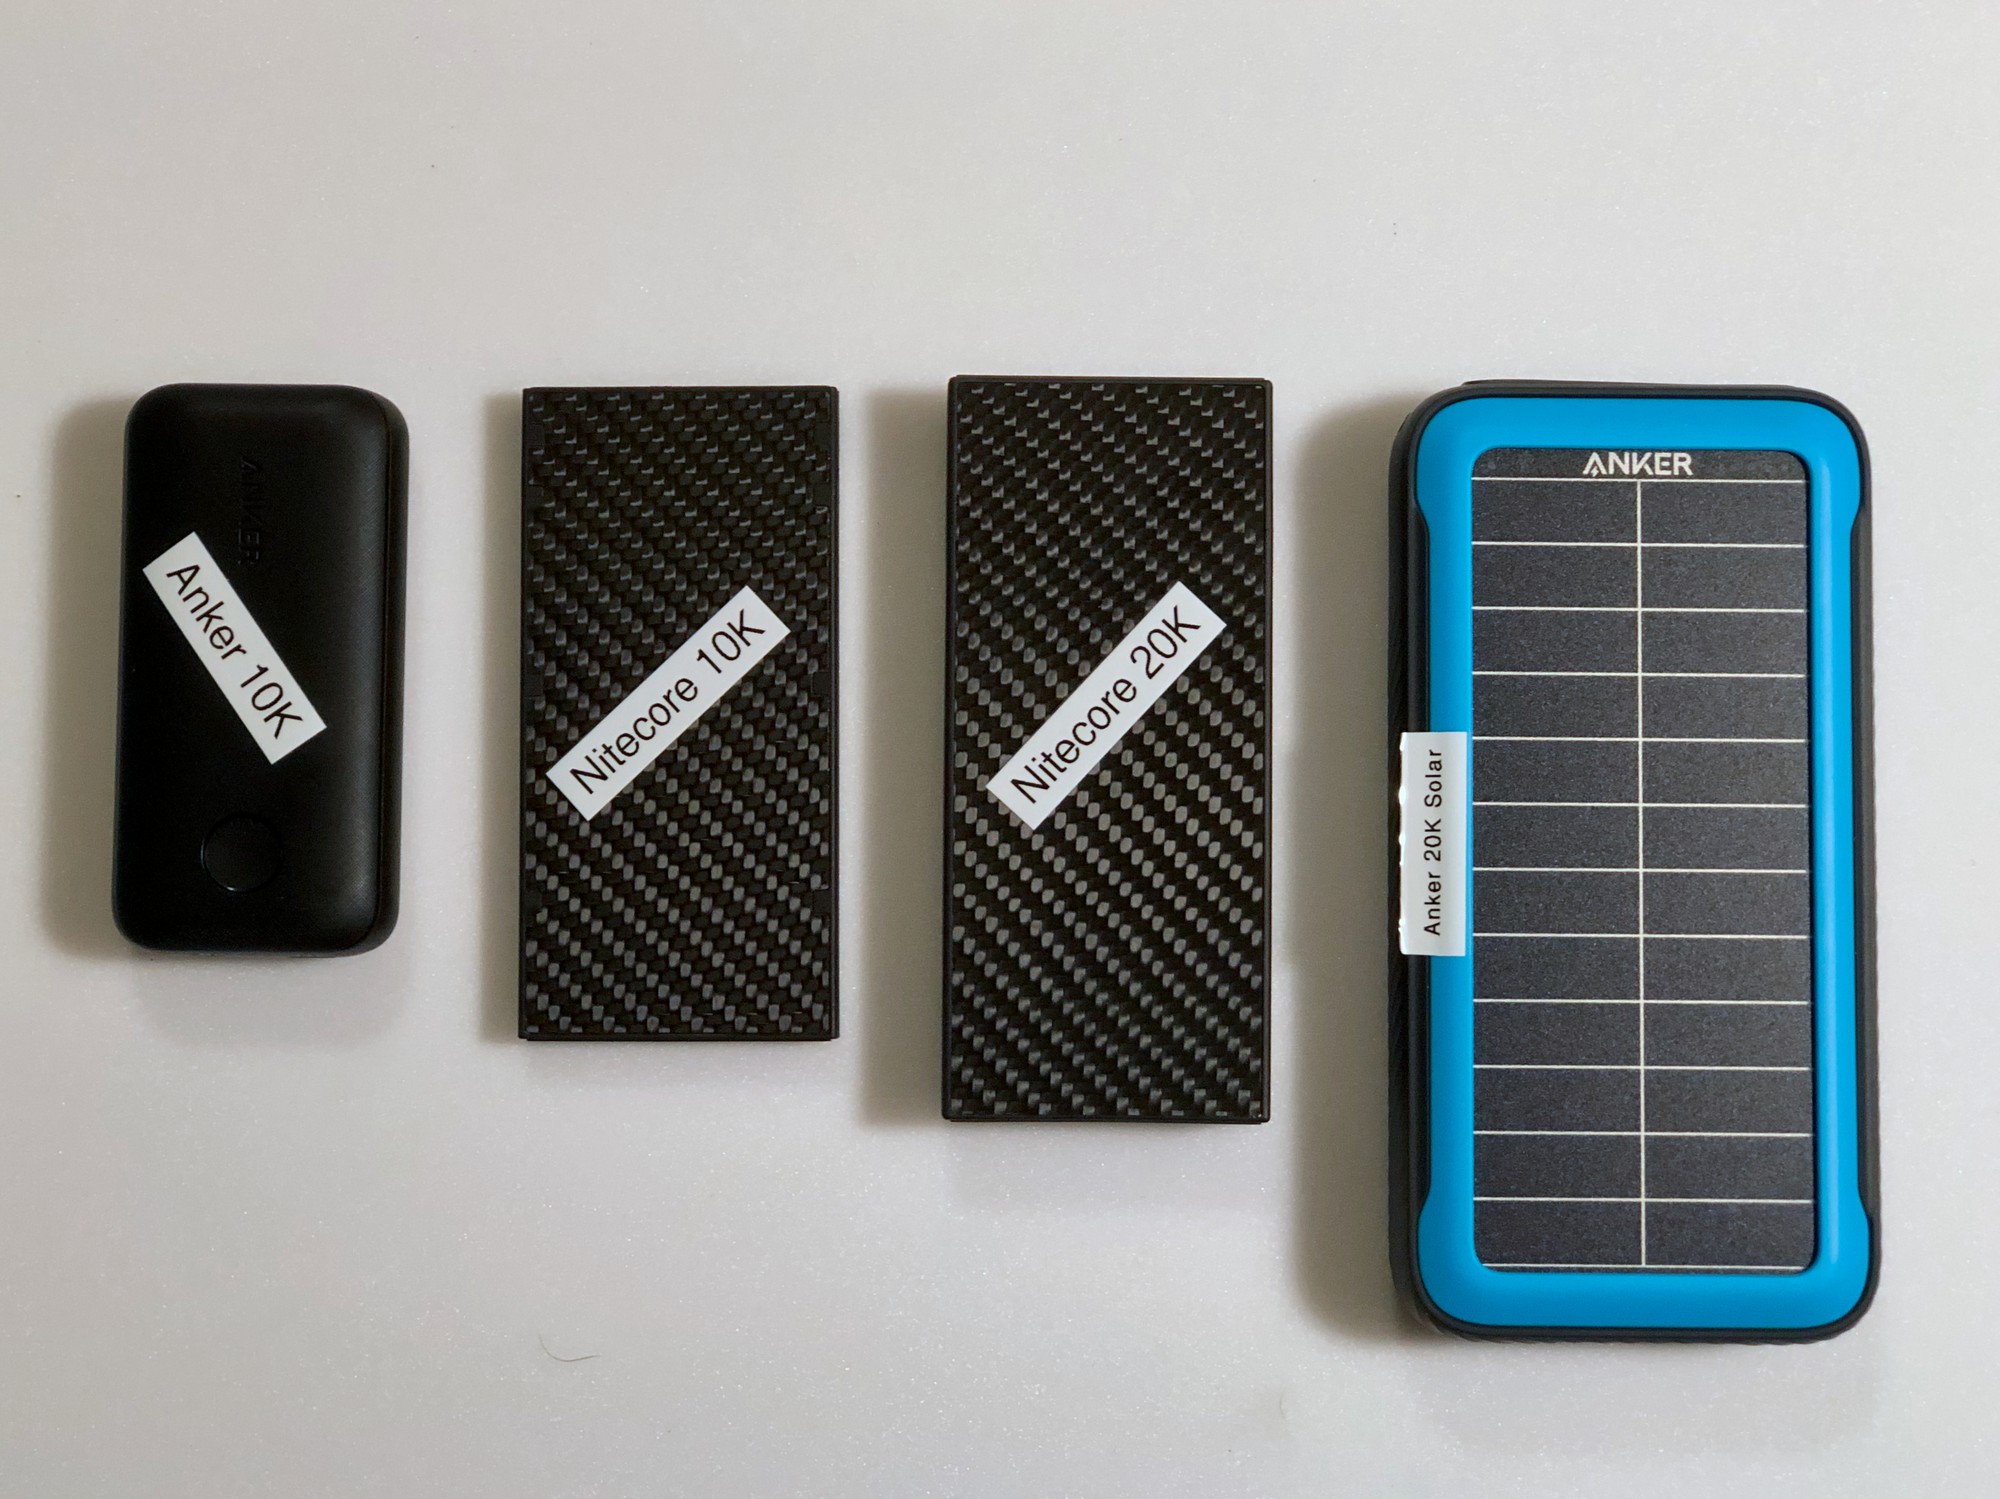
Table 3: Tested 10,000 mAh Class Portable Battery Charger Specifications
| name | Anker PowerCore 10000 PD Redux | Nitecore NB10000 |
|---|---|---|
| USB-C ports | 1 | 1 |
| USB-C maximum output | 18 W | 18 W |
| USB-C maximum input | 18 W | 18 W |
| USB-A ports | 1 | 1 |
| USB-A maximum output | 12 W | 18 W |
| operating temperature | 32 °F to 113 °F (0 °C to 45 °C) | 14 °F to 104 °F (-10 °C to 40 °C) |
| storage temperature | not specified | -4 °F to 140 °F (-20 °C to 60 °C) |
| MSRP | $49.99 | $59.95 |
Table 4: Tested 20,000 mAh Class Portable Battery Charger Specifications
| name | Anker PowerCore Solar 20000 | Nitecore NB20000 |
|---|---|---|
| USB-C ports | 1 | 2 |
| USB-C maximum output | 18 W | 45 W |
| USB-C maximum input | 18 W | 30 W |
| USB-A ports | 1 | 2 |
| USB-A maximum output | 12 W | 18 W |
| operating temperature | 32 °F to 131 °F (0 °C to 55 °C) | 14 °F to 104 °F (-10 °C to 40 °C) |
| storage temperature | not specified | -4 °F to 140 °F (-20 °C to 60 °C) |
| MSRP | $59.99 | $99.95 |
What was the methodology used for the Solar Recharging Test?
This test measures how much energy was stored under two hours of full sunlight around solar noon. While backpacking, most solar recharging will occur at slower rates due to shade, weather, and changing sun angles.
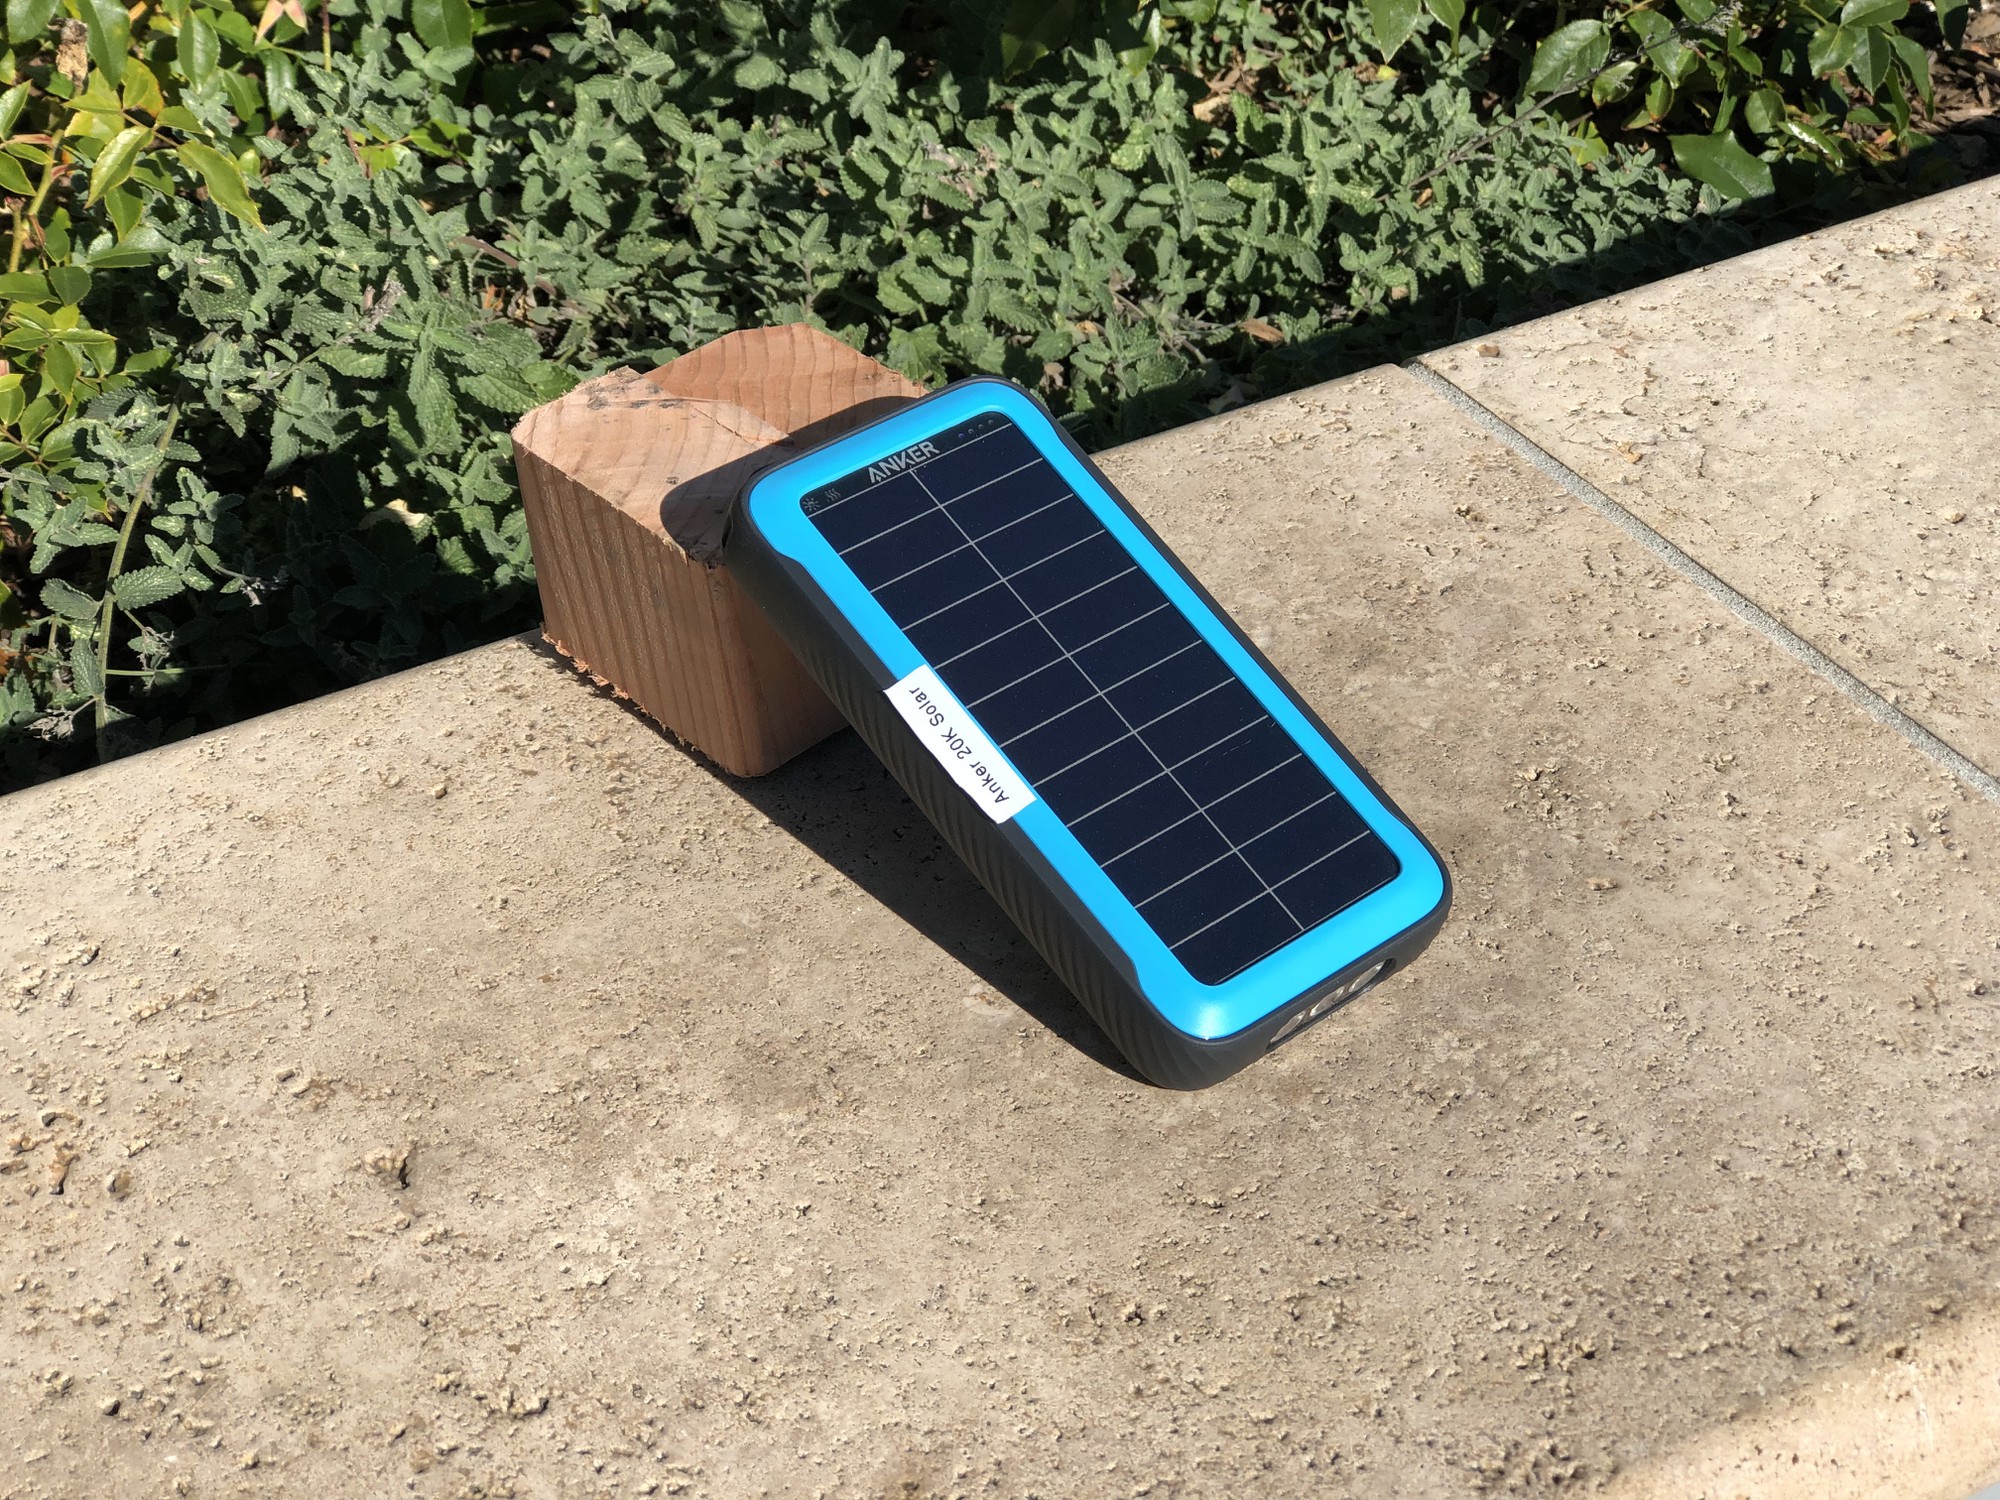
The solar recharging tests were conducted during December, with less sunlight than during the typical summer backpacking season. In June, the solar cells might absorb twice as much energy at the same location.
The methodology is described in detail below:
Test Duration:
- about 3 hours
Materials:
- solar PBC
- wood support block
- Delivered Energy test materials (i.e., see BatteryBench)
Method:
- Fully discharge the solar PBC, then cover it to prevent premature recharging.
- Take the PBC and wood support block to an unobstructed location outdoors on a sunny, cloudless day.
- At one hour before solar noon, uncover and set up the PBC facing due south, tilted at an angle that places the solar panel perpendicular to the sun.
- Recharge the PBC via solar energy only for two hours.
- Note the date, latitude, and ambient temperature.
- After two hours, cover the PBC.
- Run the Delivered Energy test without recharging.
- Compute: SolarWatts = NewDeliveredEnergyWh / 2.
BatteryBench test results and analysis
Tables from the BatteryBench test results can be found scattered throughout the rest of the article in the relevant sections.
Table 5: Basic Measurements of Anker PowerCore 10000 PD Redux and Nitecore NB10000
| name | Anker PowerCore 10000 PD Redux | Nitecore NB10000 |
|---|---|---|
| weight | 6.8 ounces (194 g) | 5.4 ounces (153 g) |
| dimensions | 4 x 2 x 1 inches (106 x 52 x 26 mm) | 5 x 2 x 0.5 inches (122 x 59 x 11 mm) |
| button usability | good | poor - tiny button hard to press |
| button pushing recall | easy | OK |
| USB port usability | good | poor, shallow |
| indicator light visibility | poor | poor |
| charging status light count | 4 | 3 |
| light patterns | OK | OK |
| light pattern recall | OK | OK |
| case material | plastic | carbon fiber |
| case corners and edges | rounded | squared, sharp |
| case toughness | OK | good |
| case protrusion count | 0 | 0 |
| port and button protection | OK | OK |
Table 6: Basic Measurements of Anker PowerCore Solar 20000 and Nitecore NB20000
| name | Anker PowerCore Solar 20000 | Nitecore NB20000 |
|---|---|---|
| weight | 16.9 ounces (478 g) | 11.5 ounces (327 g) |
| dimensions | 7 x 3 x 1 inches (176 x 88 x 30 mm) | 5 x 2 x 1 inches (136 x 60 x 21 mm) |
| button usability | good | OK |
| button pushing recall | OK | OK |
| USB port usability | poor, port cover difficult | poor, shallow |
| indicator light visibility | good | poor |
| charging status light count | 4 | 4 |
| light patterns | good | OK |
| light pattern recall | good | OK |
| case material | plastic | carbon fiber |
| case corners and edges | rounded | squared, sharp |
| case toughness | good | good |
| case protrusion count | four small feet | 0 |
| port and button protection | good | OK |
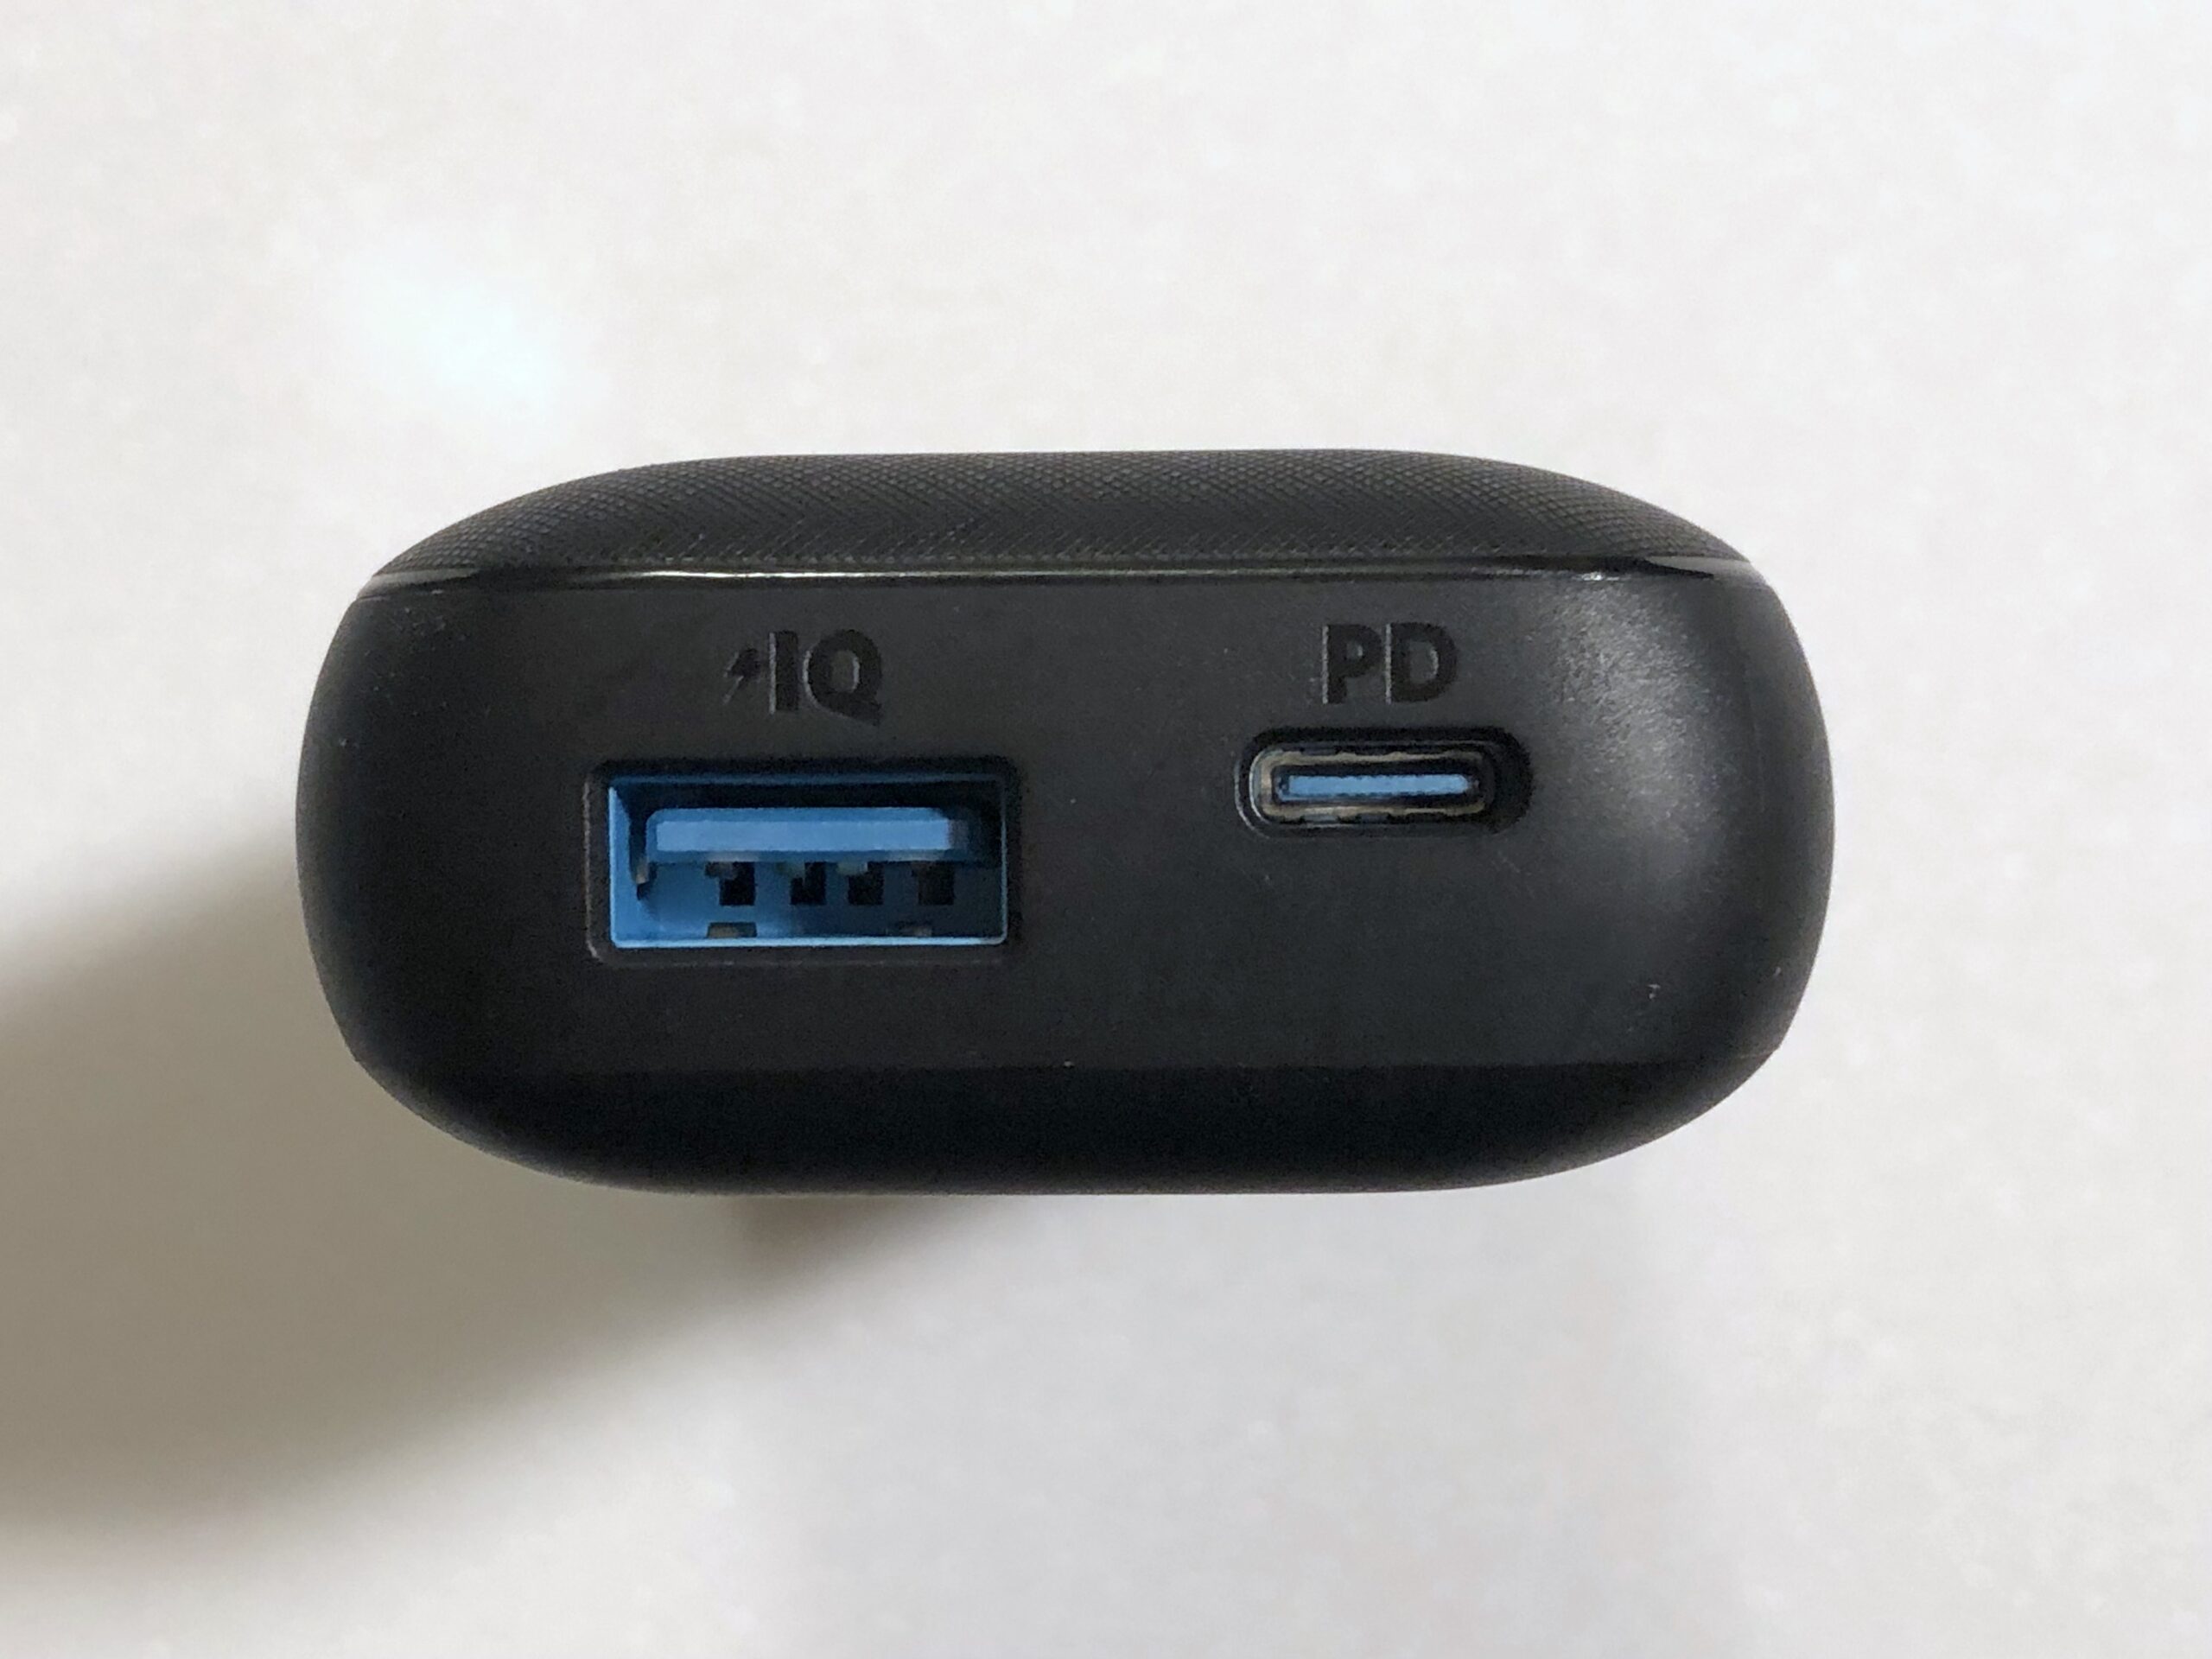
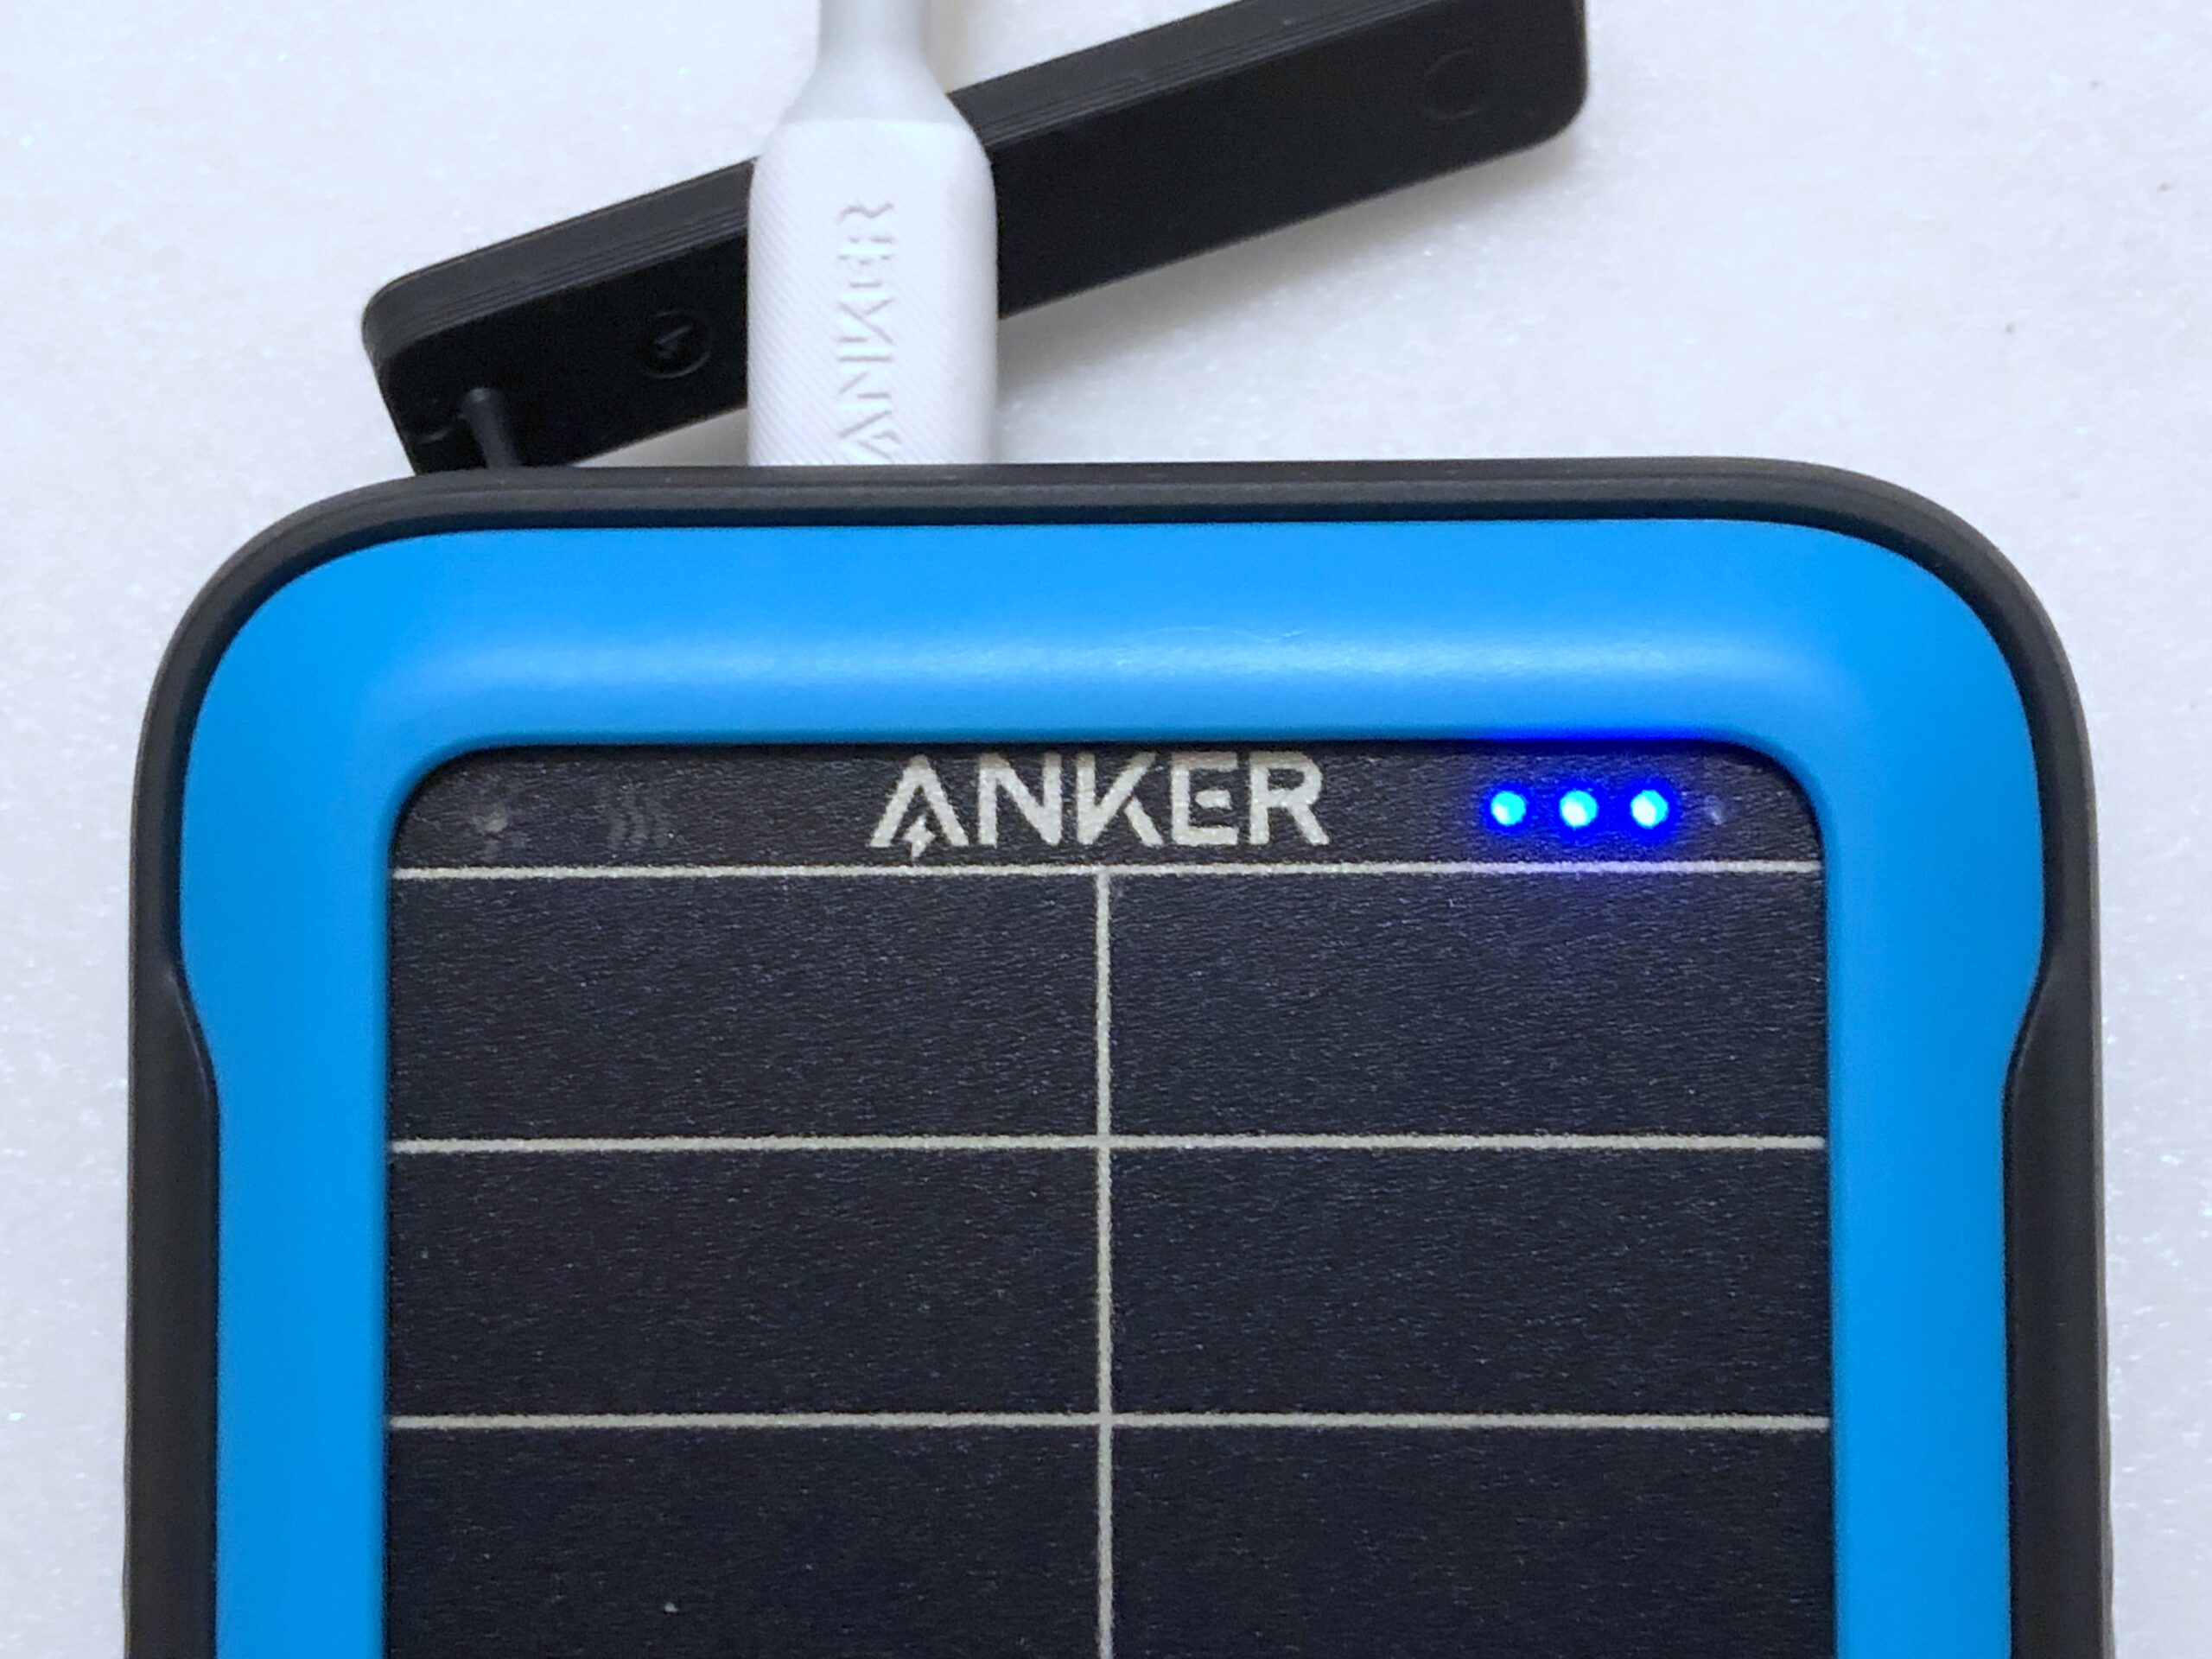
The Anker PowerCore 10000 PD Redux portable battery charger has relatively easy-to-read labels:
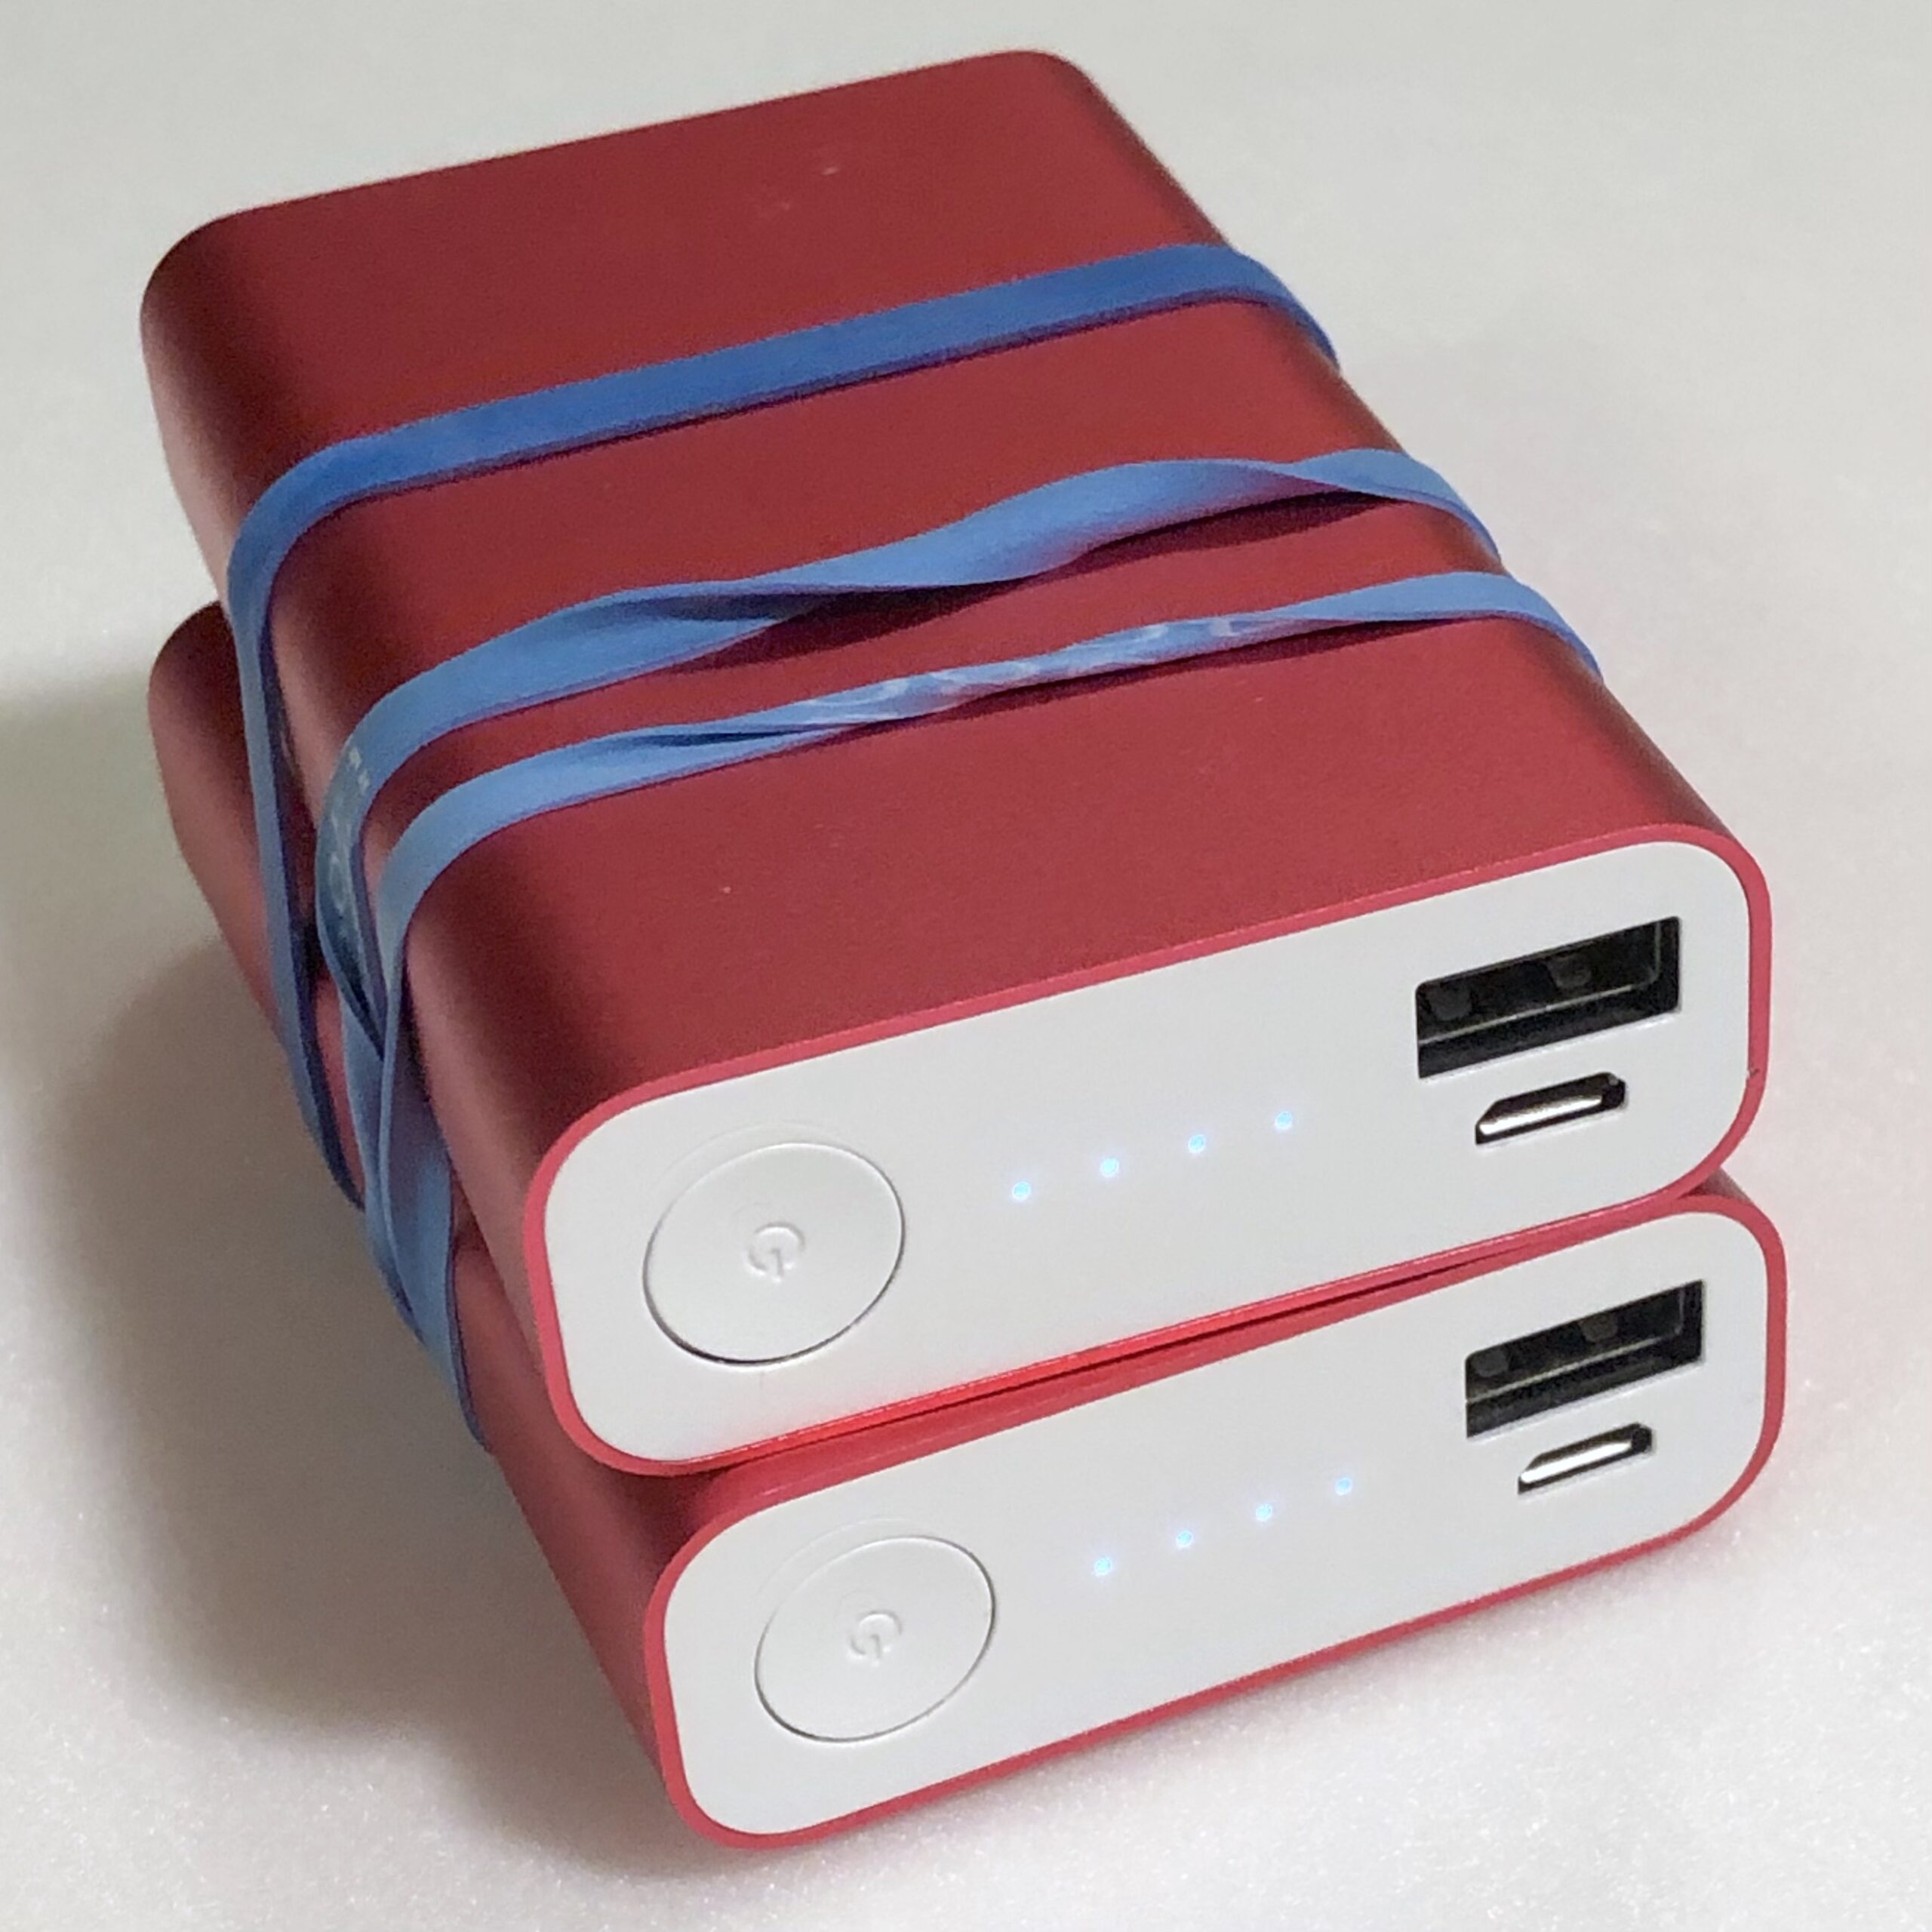
In contrast, the Nitecore NB10000 labels are hard to read. The user must view the tiny indicator LEDs from just the right angle because they are tightly packed inside the right half of the mode button.
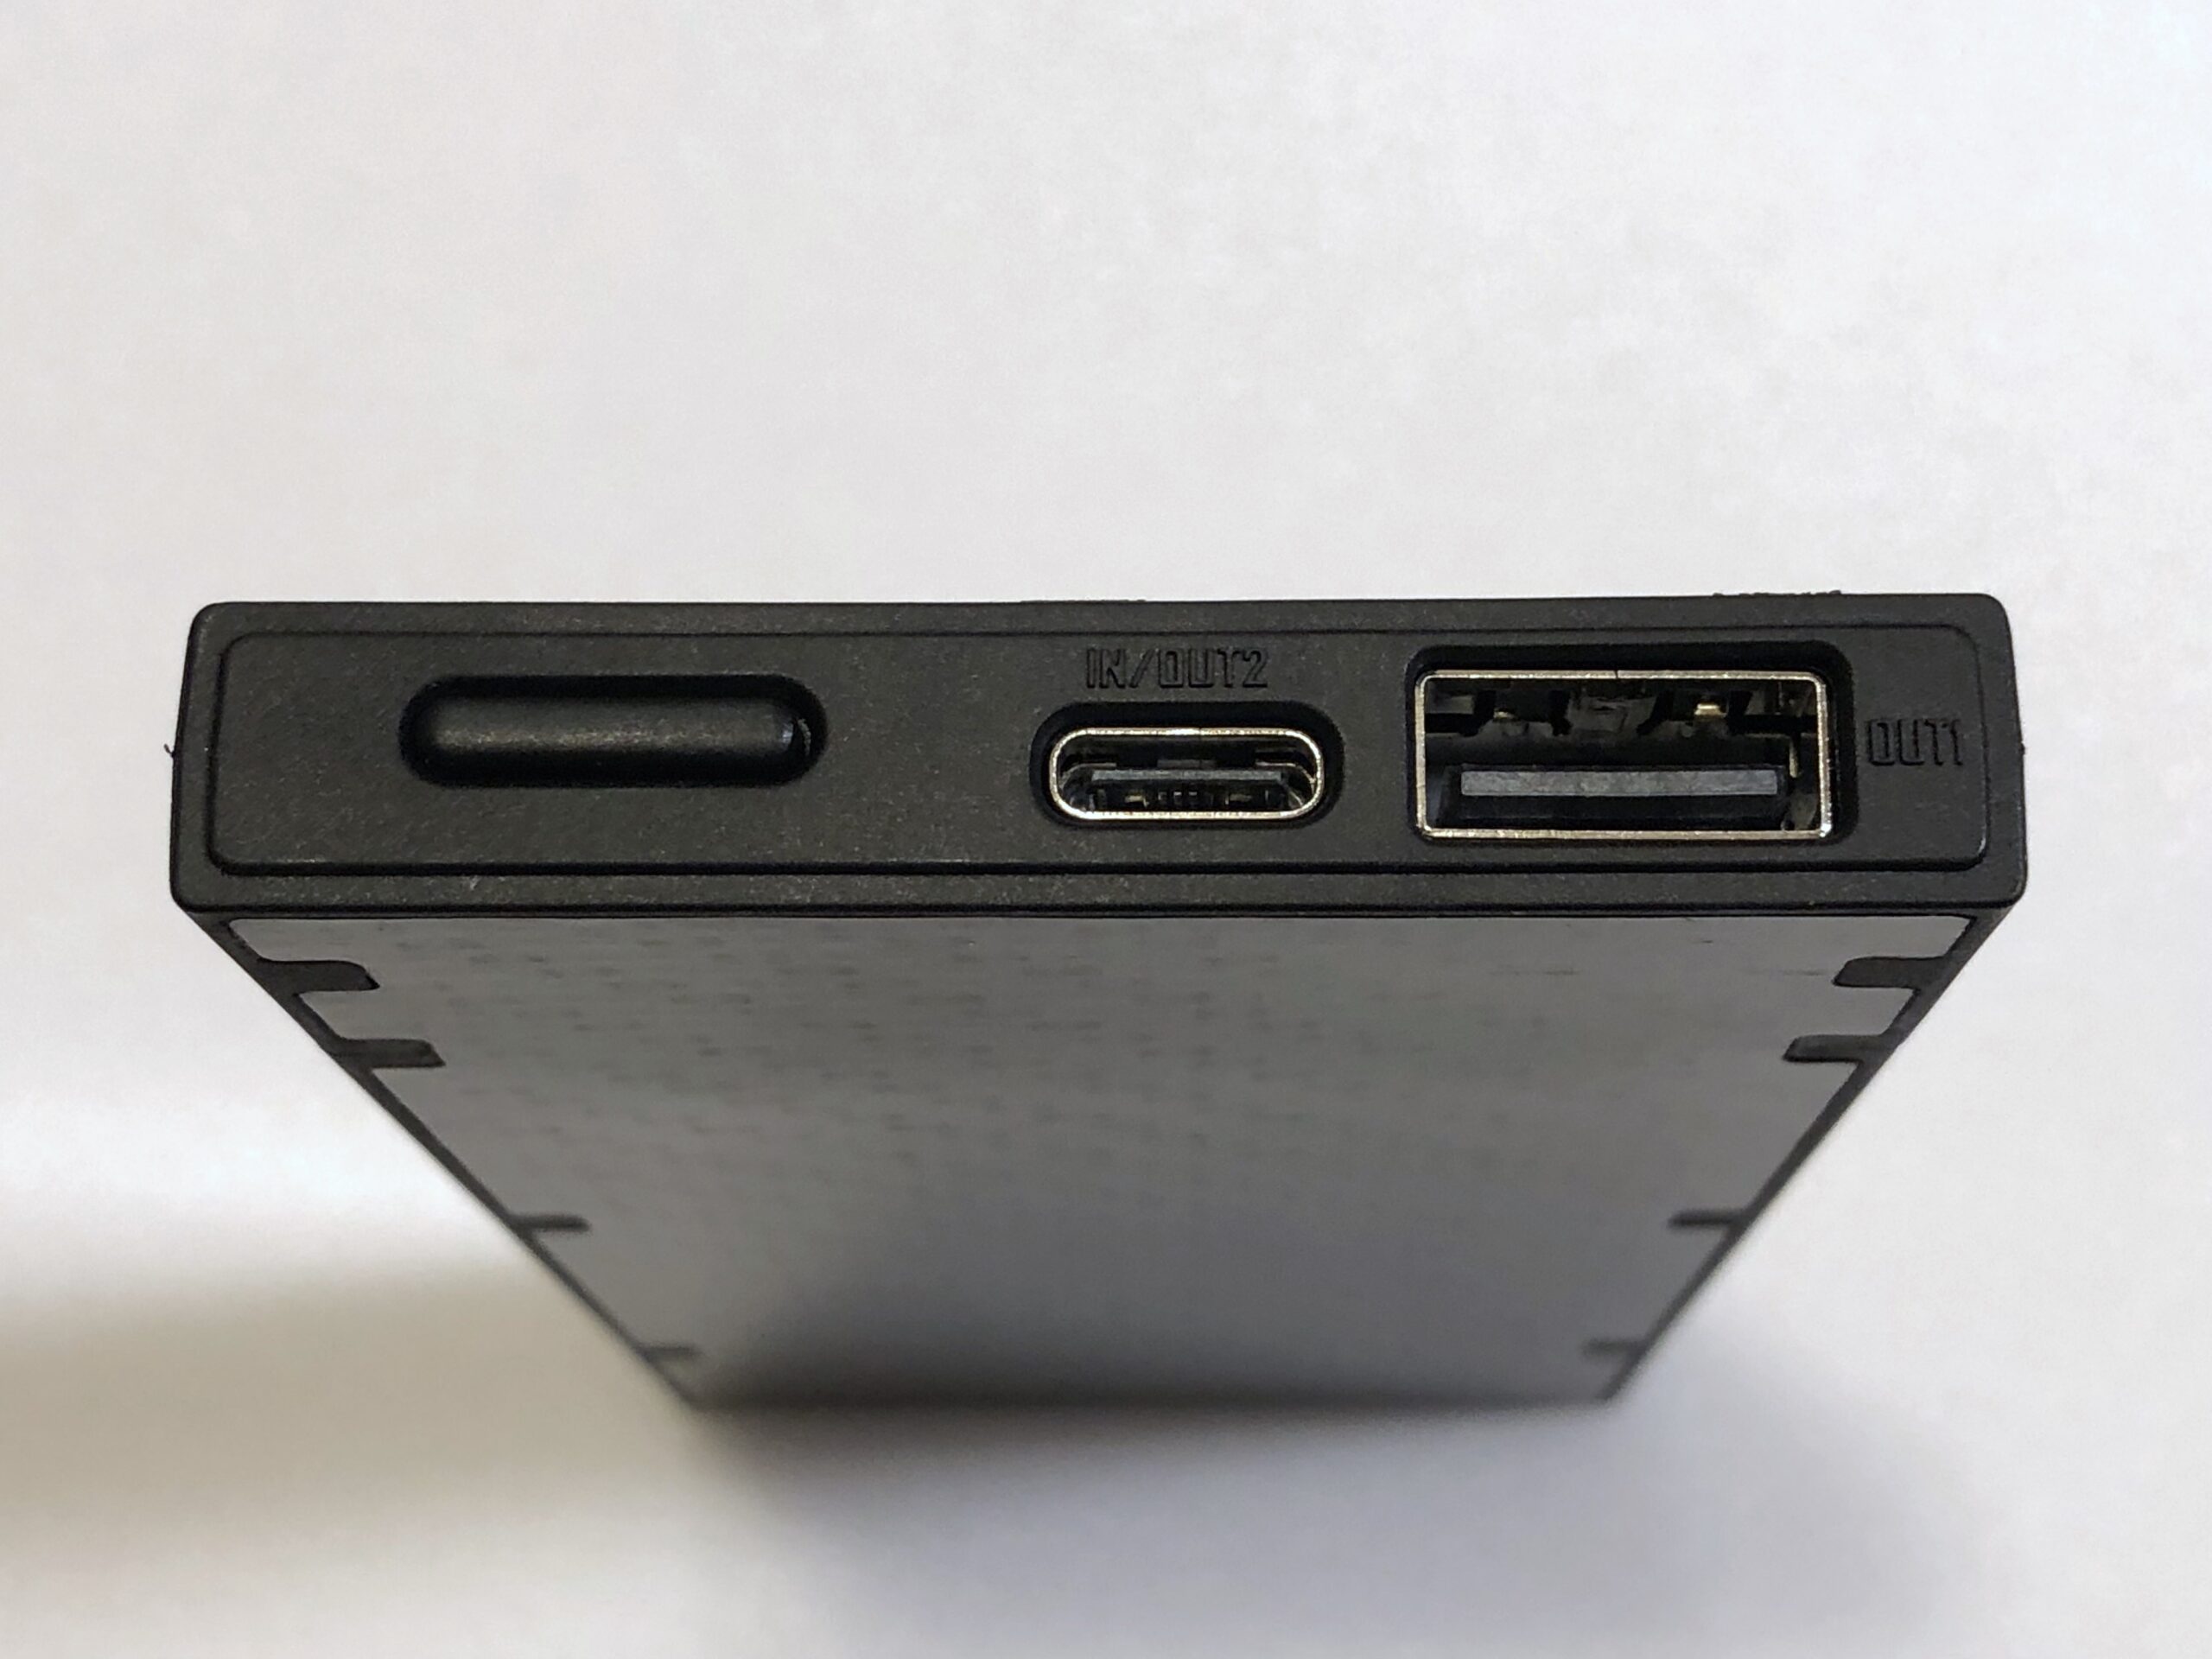
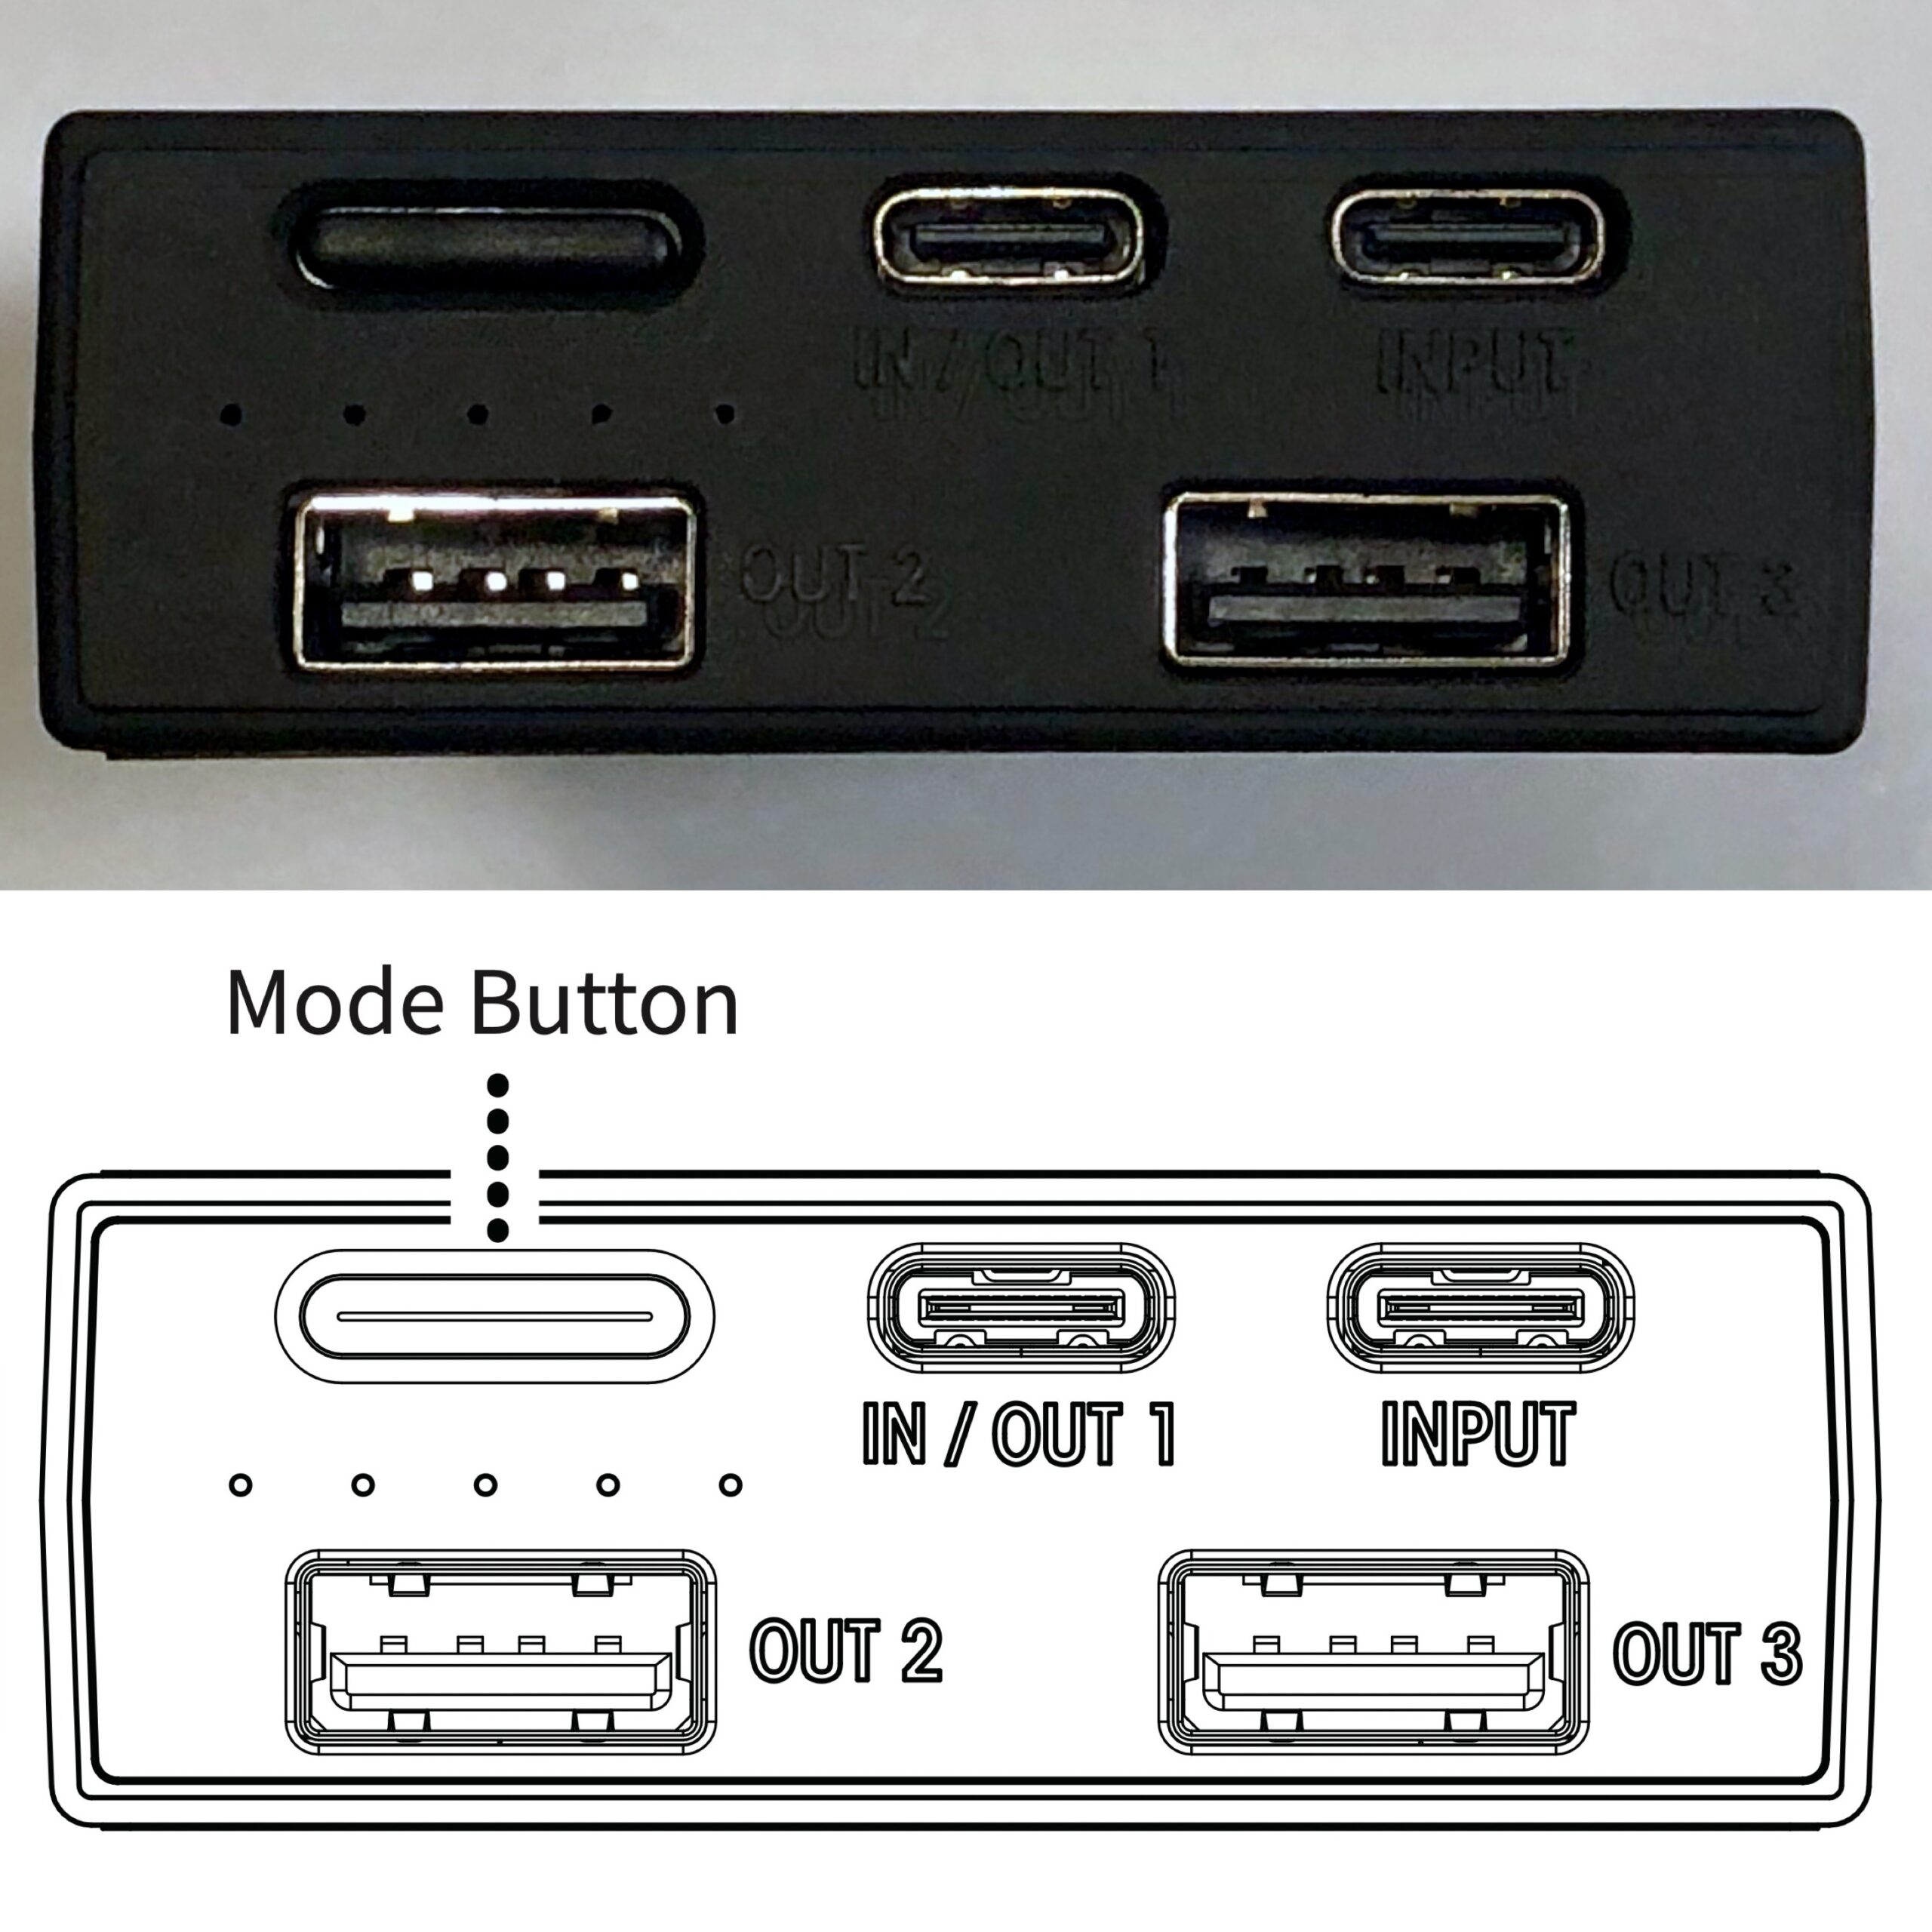
Labels on the Nitecore NB20000 are also hard to read. In addition, the USB-C ports are not identical – only the middle port can recharge other devices. The “INPUT” port never worked on the unit I tested.
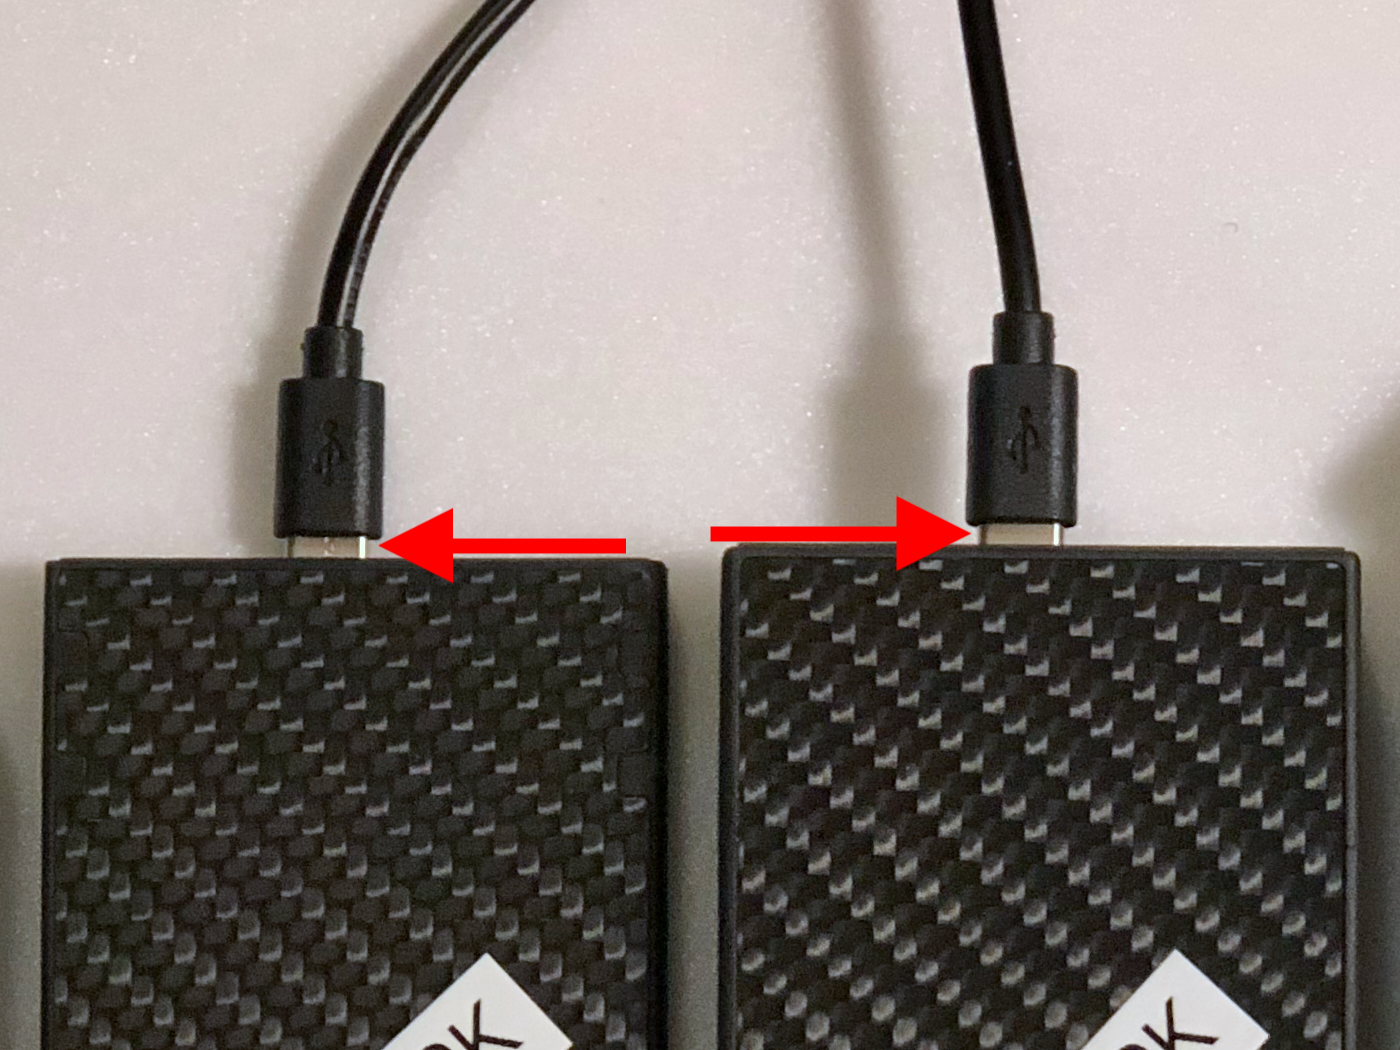
Both Nitecore portable battery chargers have shallow USB ports. After the drop tests, the USB-C ports were extra wiggly, sometimes making poor connections when a cable was hastily inserted:
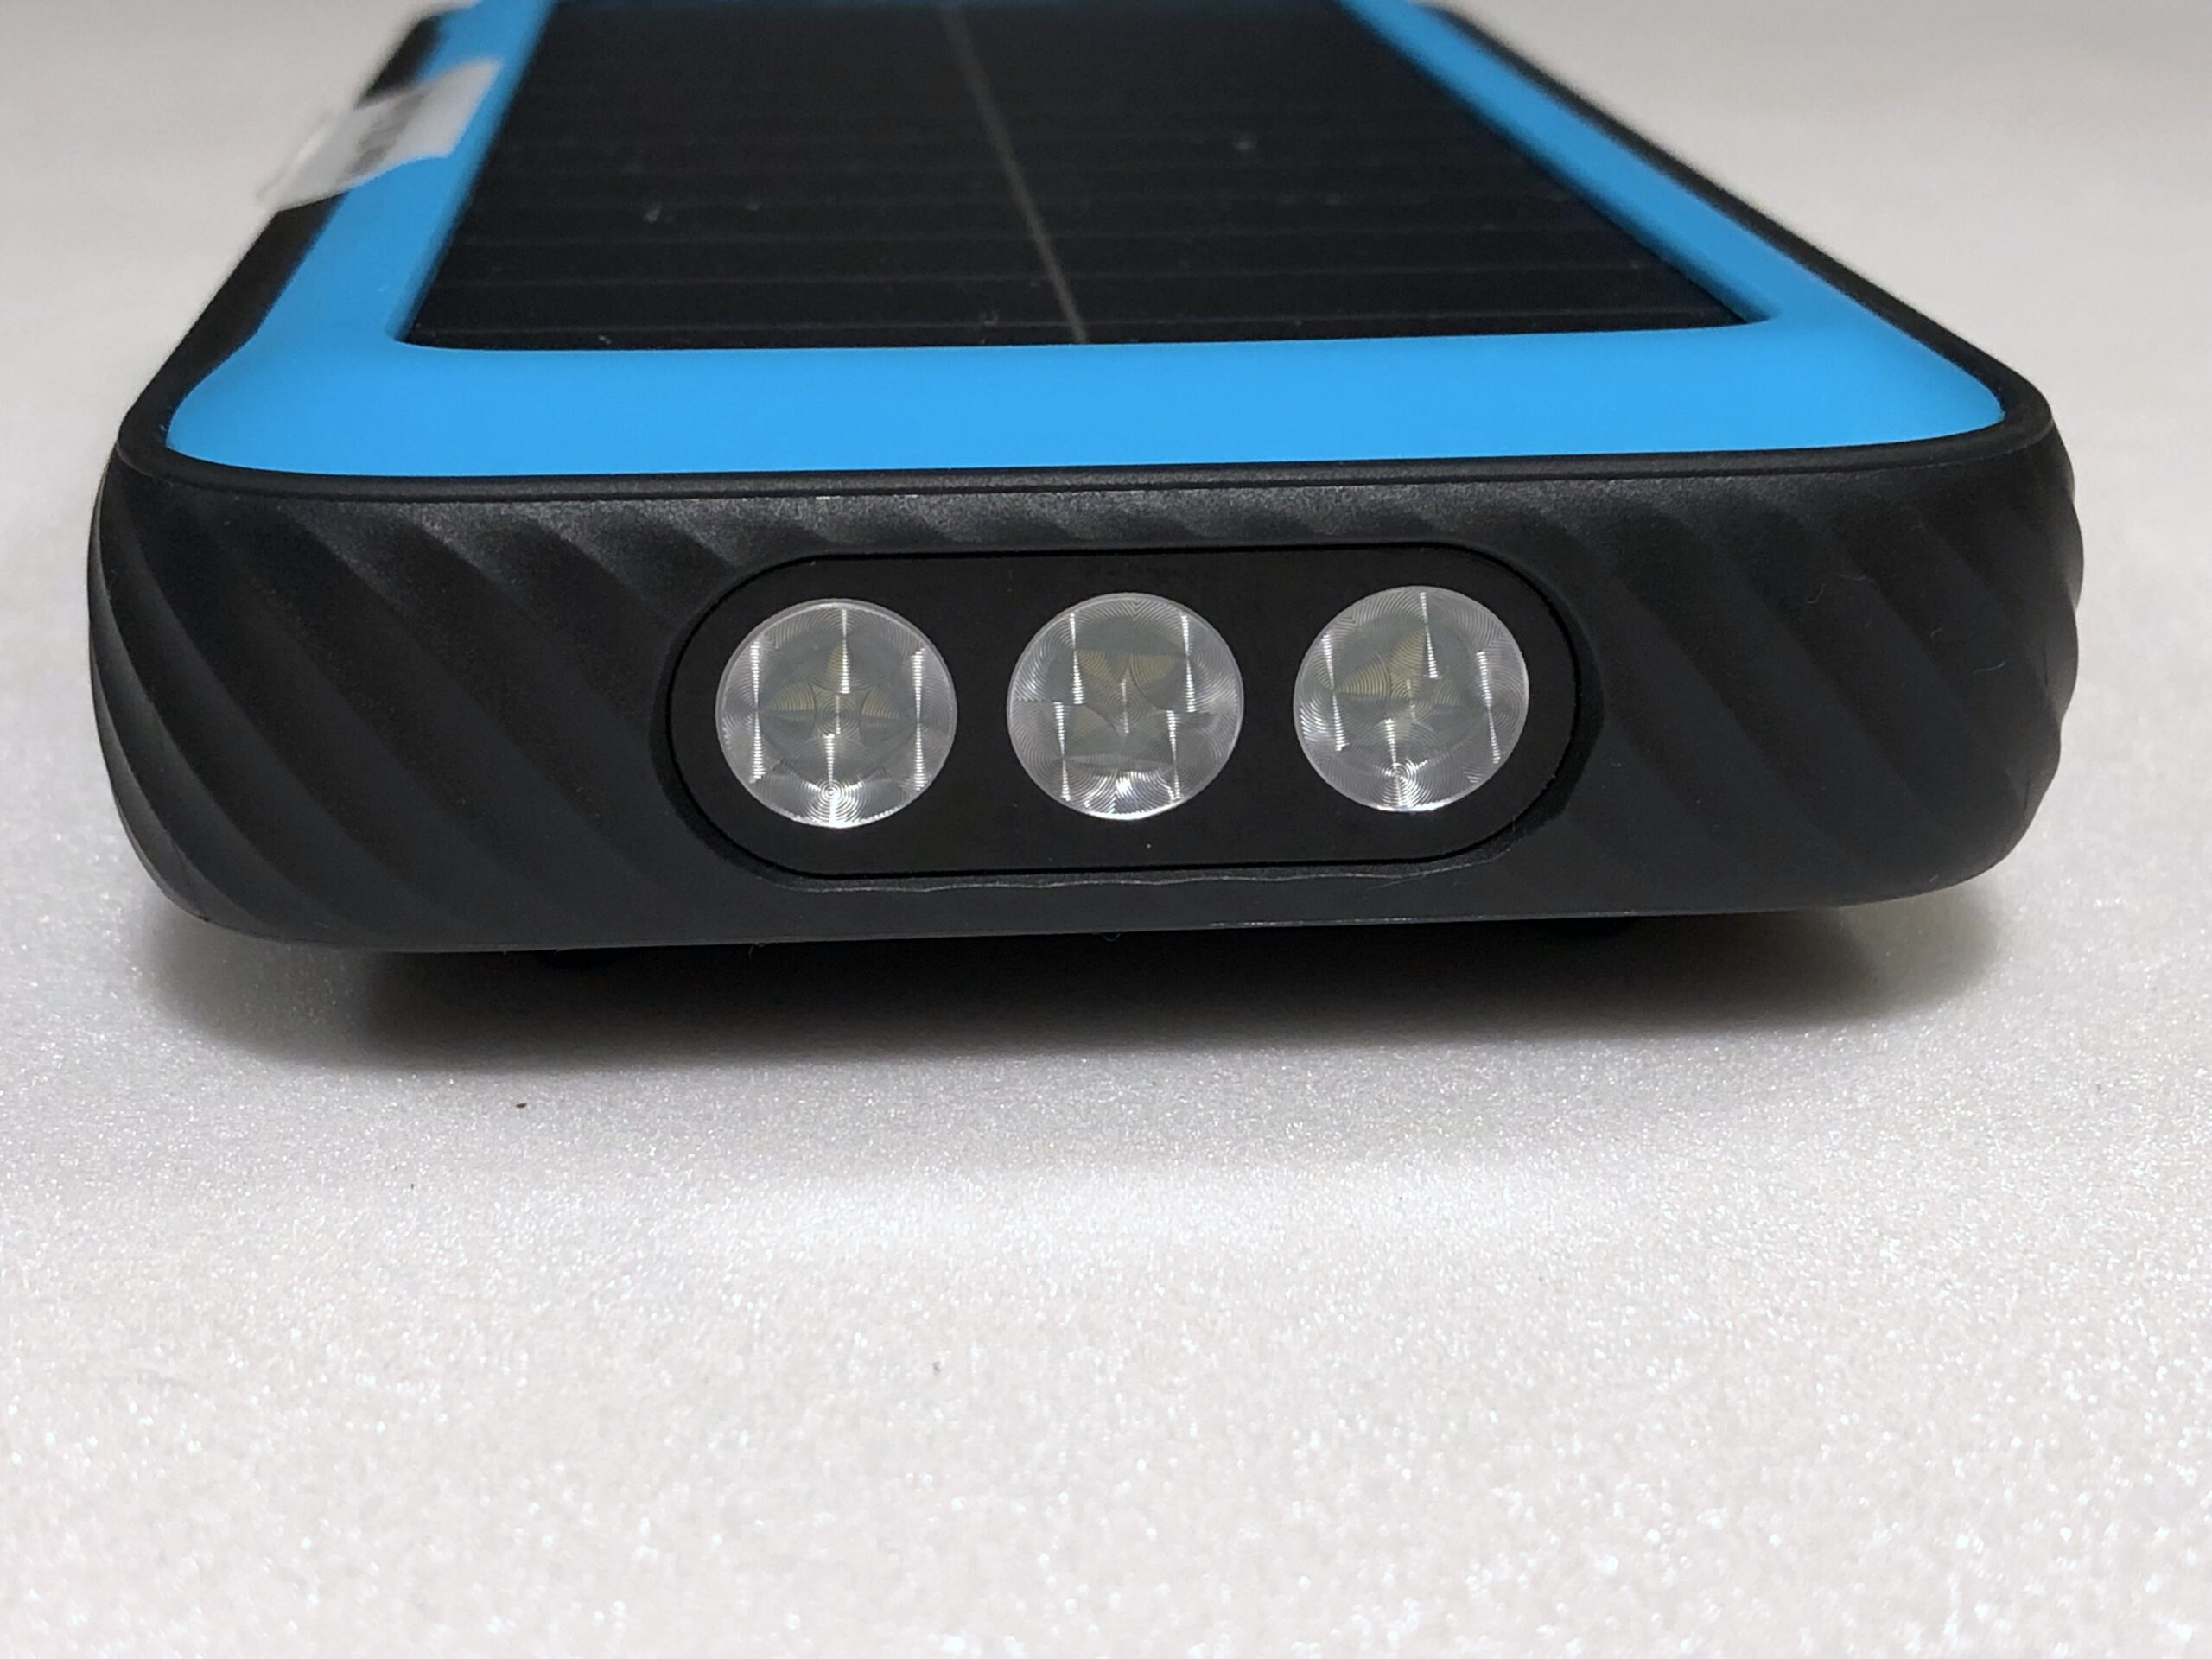
The Anker PowerCore Solar 20000 includes a built-in flashlight:
The USB port cover on the Anker PowerCore Solar 20000 is hard to insert and remove. However, it helps provide IP 65 “water-resistant” protection:
Don’t read too much into the charge-level lights of any portable battery charger. For example, during a Delivered Energy test, the Anker PowerCore Solar 20000 showed three glowing LEDs, indicating 75% energy available. In contrast, measurements showed only 50% left.
Users should consider adding their own labels to their portable battery charger. Those labels might indicate important information like button pushes and light patterns. In addition, users should consider loading a copy of the PBC user manual to their smartphones. (Of course, if the smartphone battery is dead…)
Evaluating specified vs. consumed vs. delivered energy of PBCs
Table 7: Delivered Energy – Anker PowerCore 10000 PD Redux and Nitecore NB10000
| name | Anker PowerCore 10000 PD Redux | Nitecore NB10000 |
|---|---|---|
| delivered energy | 30.9 Wh | 32.3 Wh |
| energy density | 159 Wh/kg | 211 Wh/kg |
| temperature during test | 64 °F (18 °C) | 61 °F (16 °C) |
The following graphs show the differences between the manufacturer’s specified energy density (Wh), energy consumed during recharging, and energy delivered by the USB-C port for the Anker PowerCore 10000 PD Redux and Nitecore NB10000.
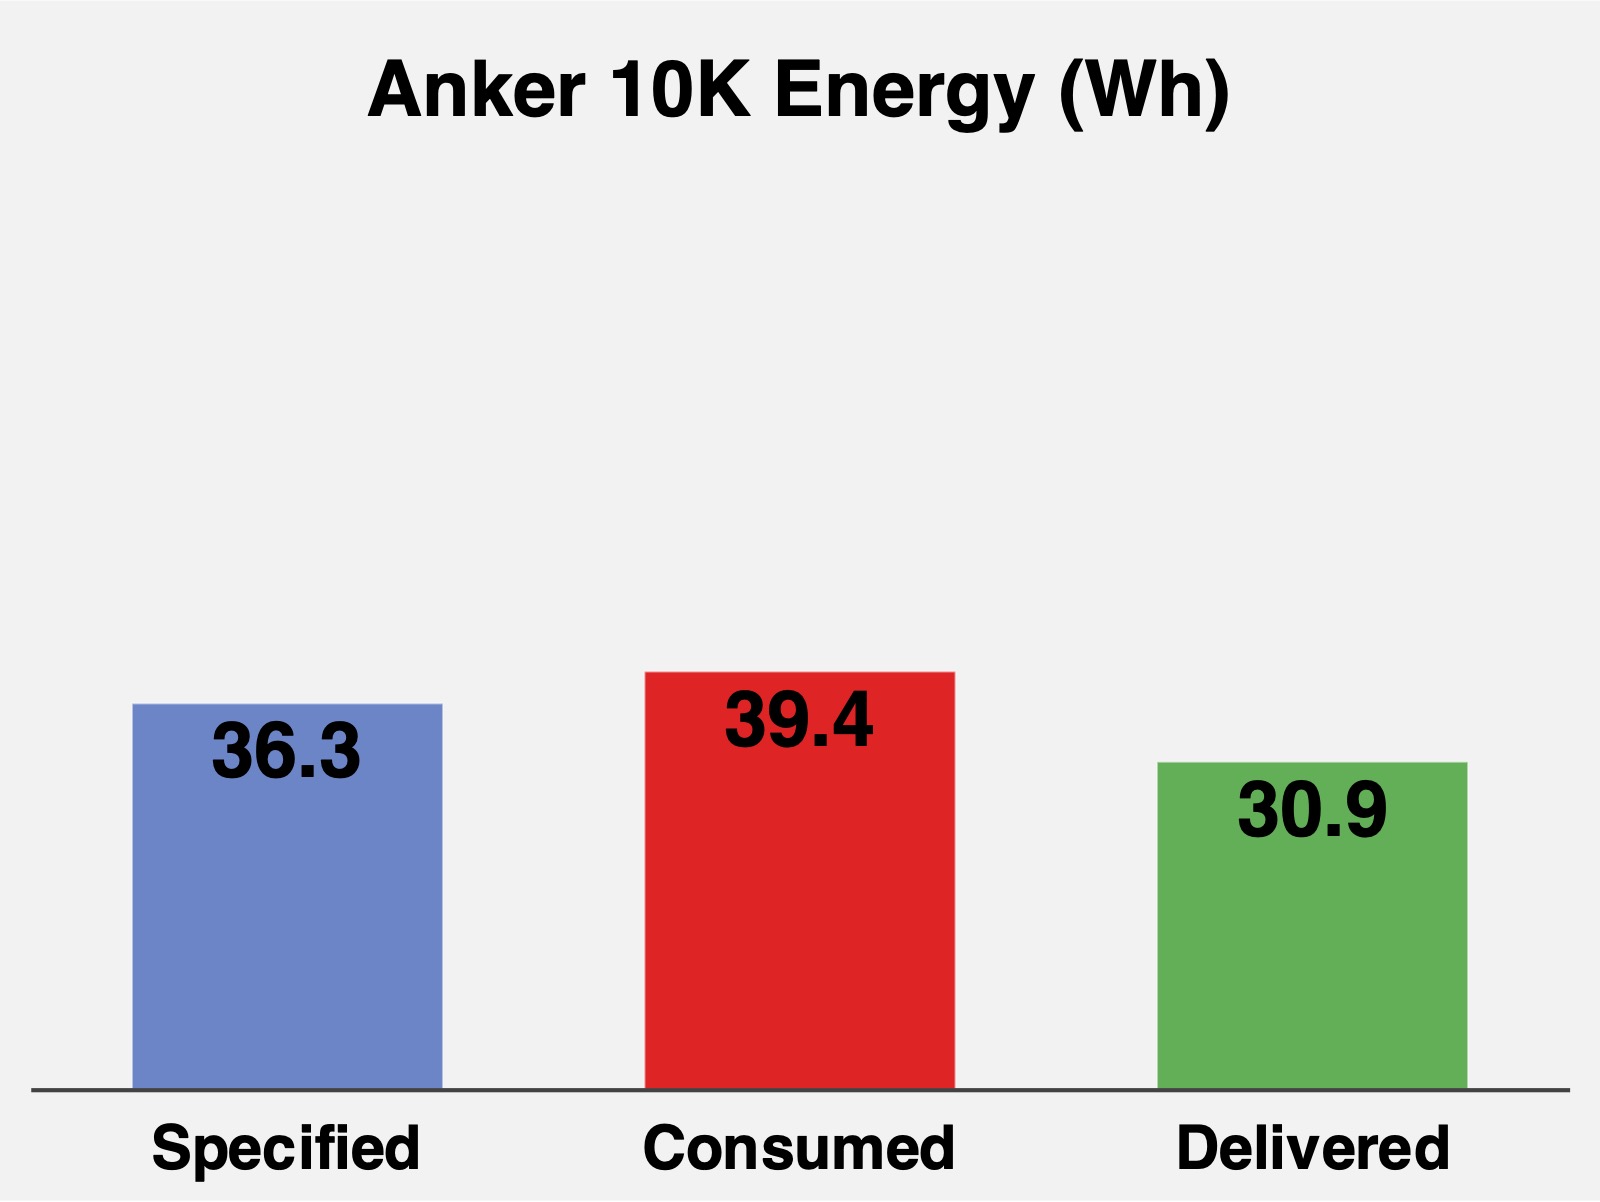
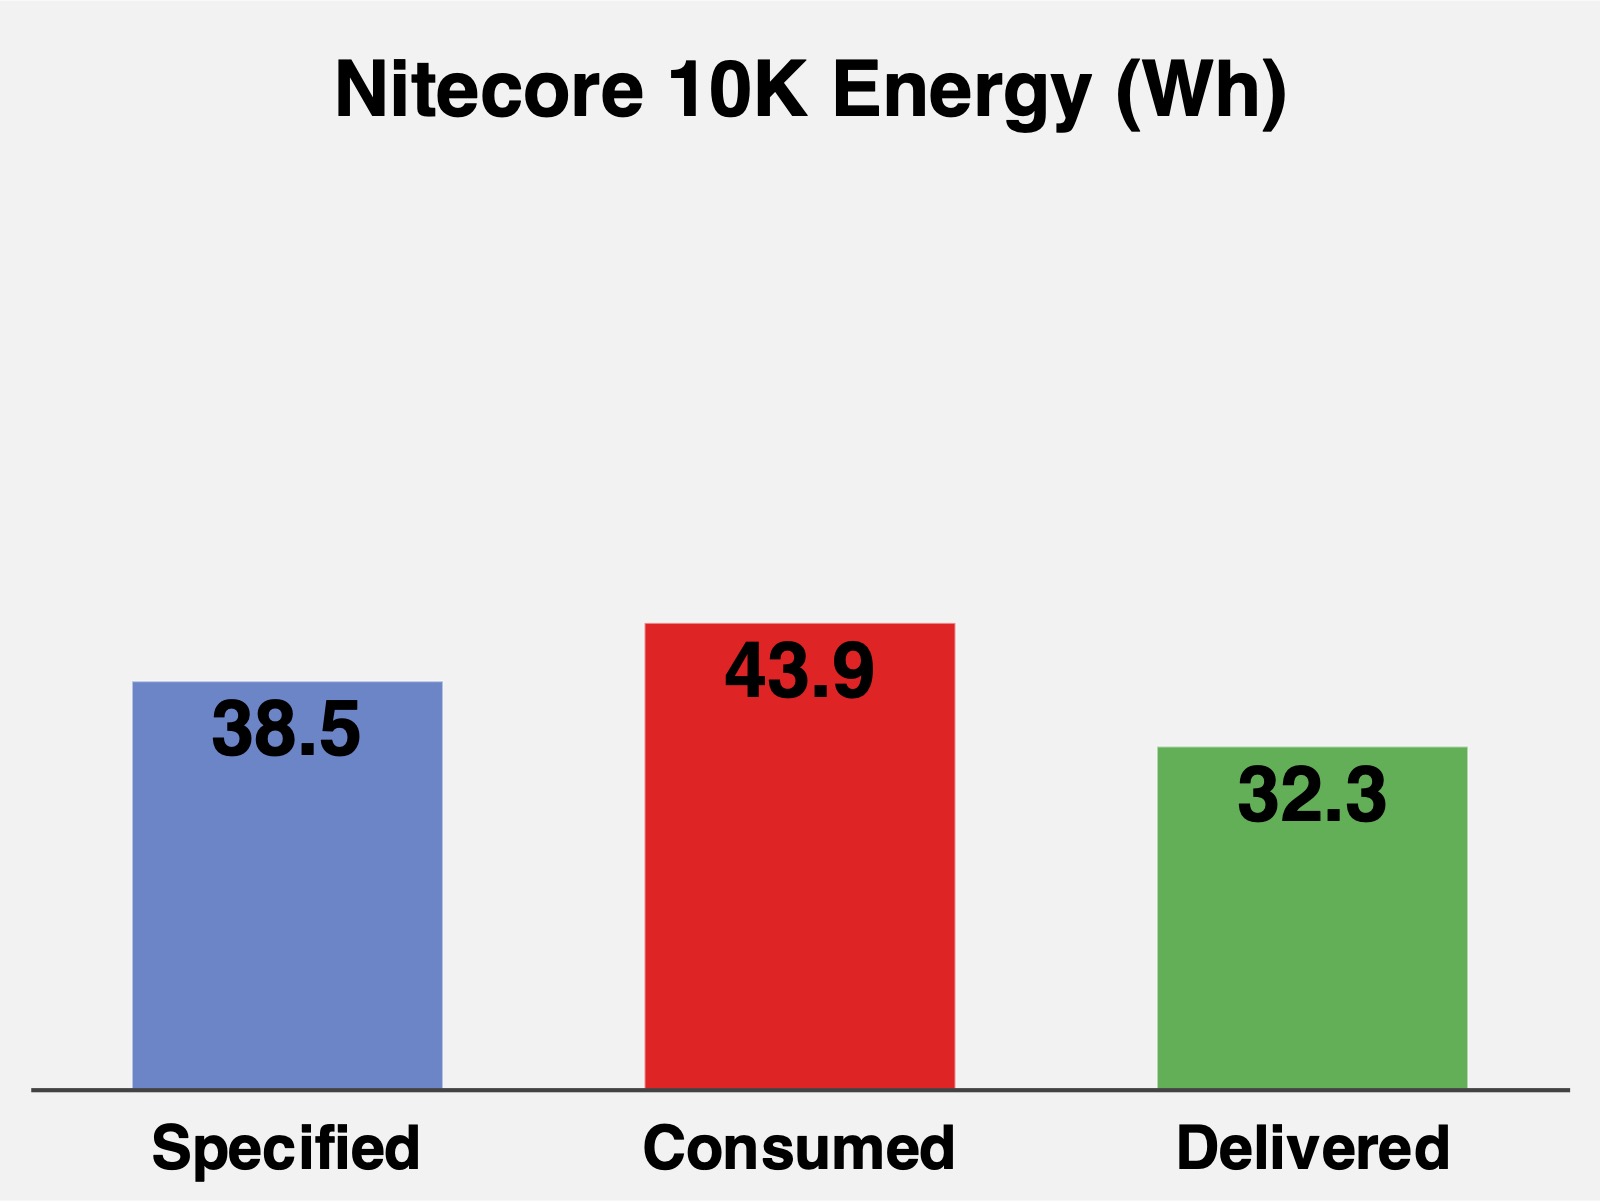
Table 8: Delivered Energy – Anker PowerCore Solar 20000 and Nitecore NB20000
| name | Anker PowerCore Solar 20000 | Nitecore NB20000 |
|---|---|---|
| delivered energy | 64.0 Wh | 70.2 Wh |
| energy density | 134 Wh/kg | 215 Wh/kg |
| temperature during test | 61 °F (16 °C) | 61 °F (16 °C) |
The following graphs show the differences between the manufacturer’s specified energy density (Wh), energy consumed during recharging, and energy delivered by the USB-C port for the Anker PowerCore Solar 20000 and Nitecore NB20000.
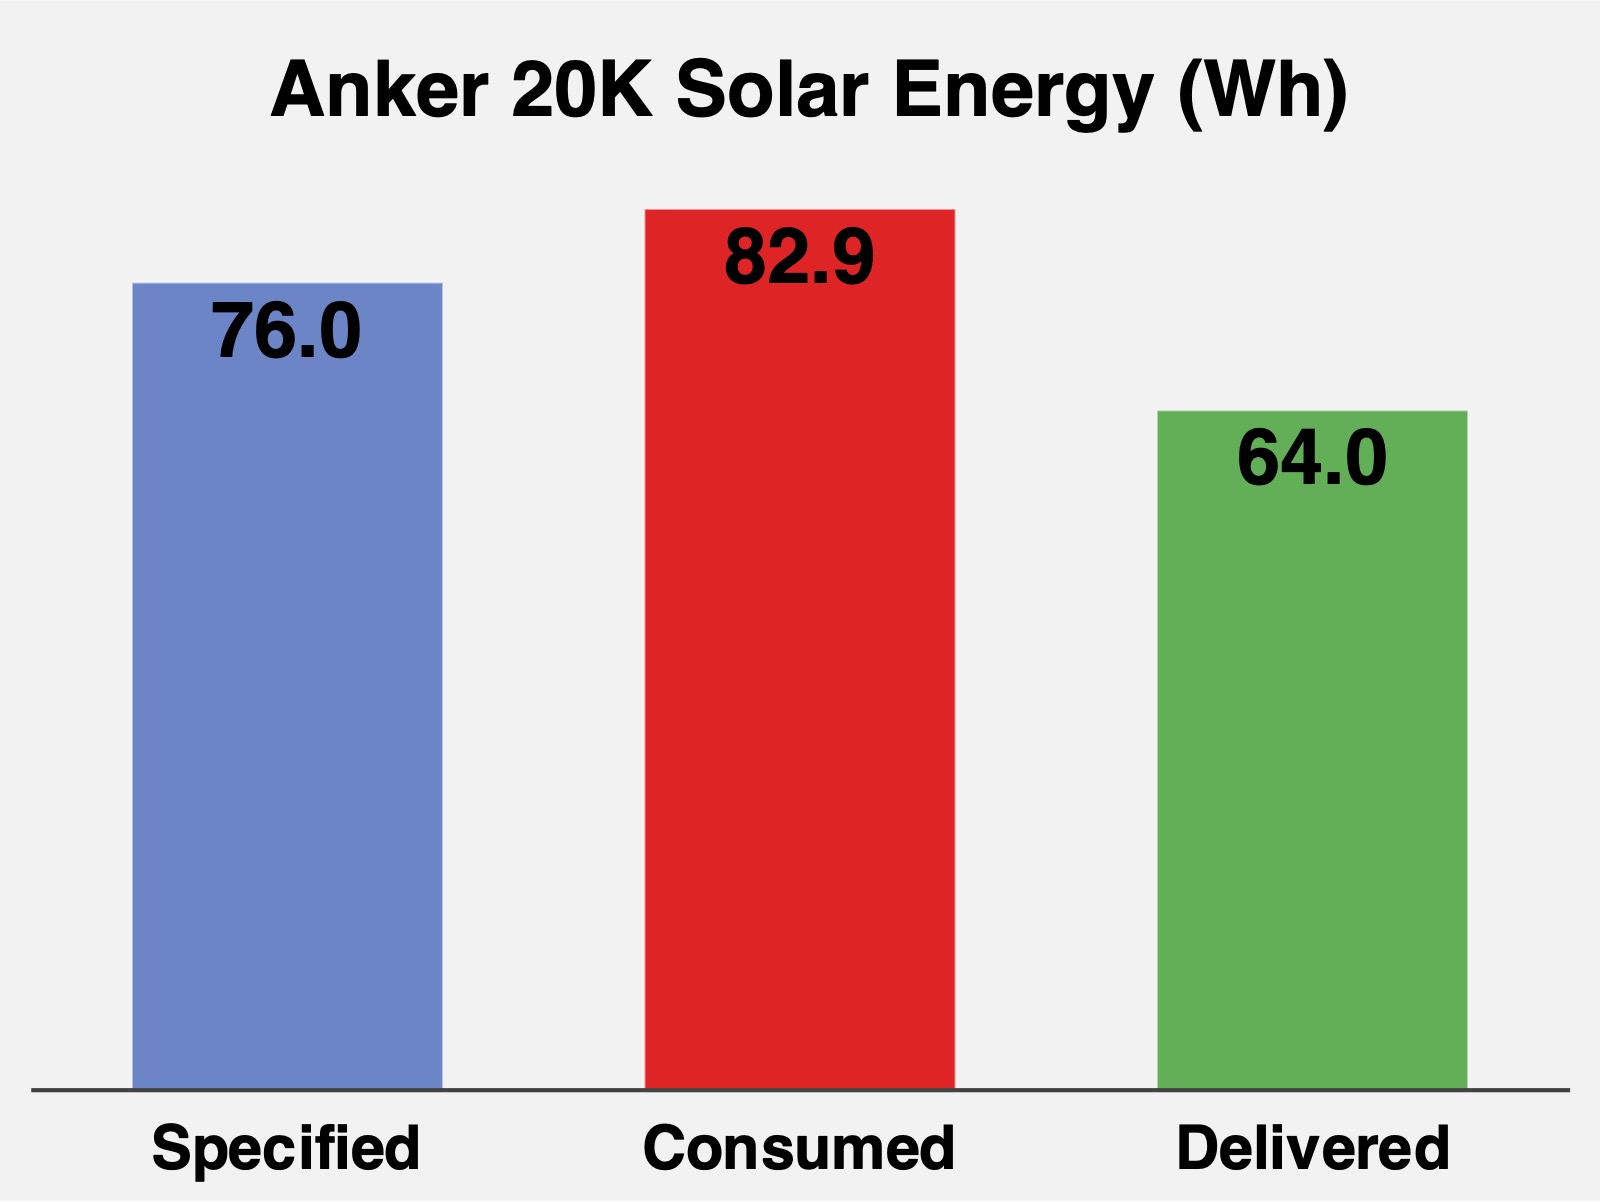
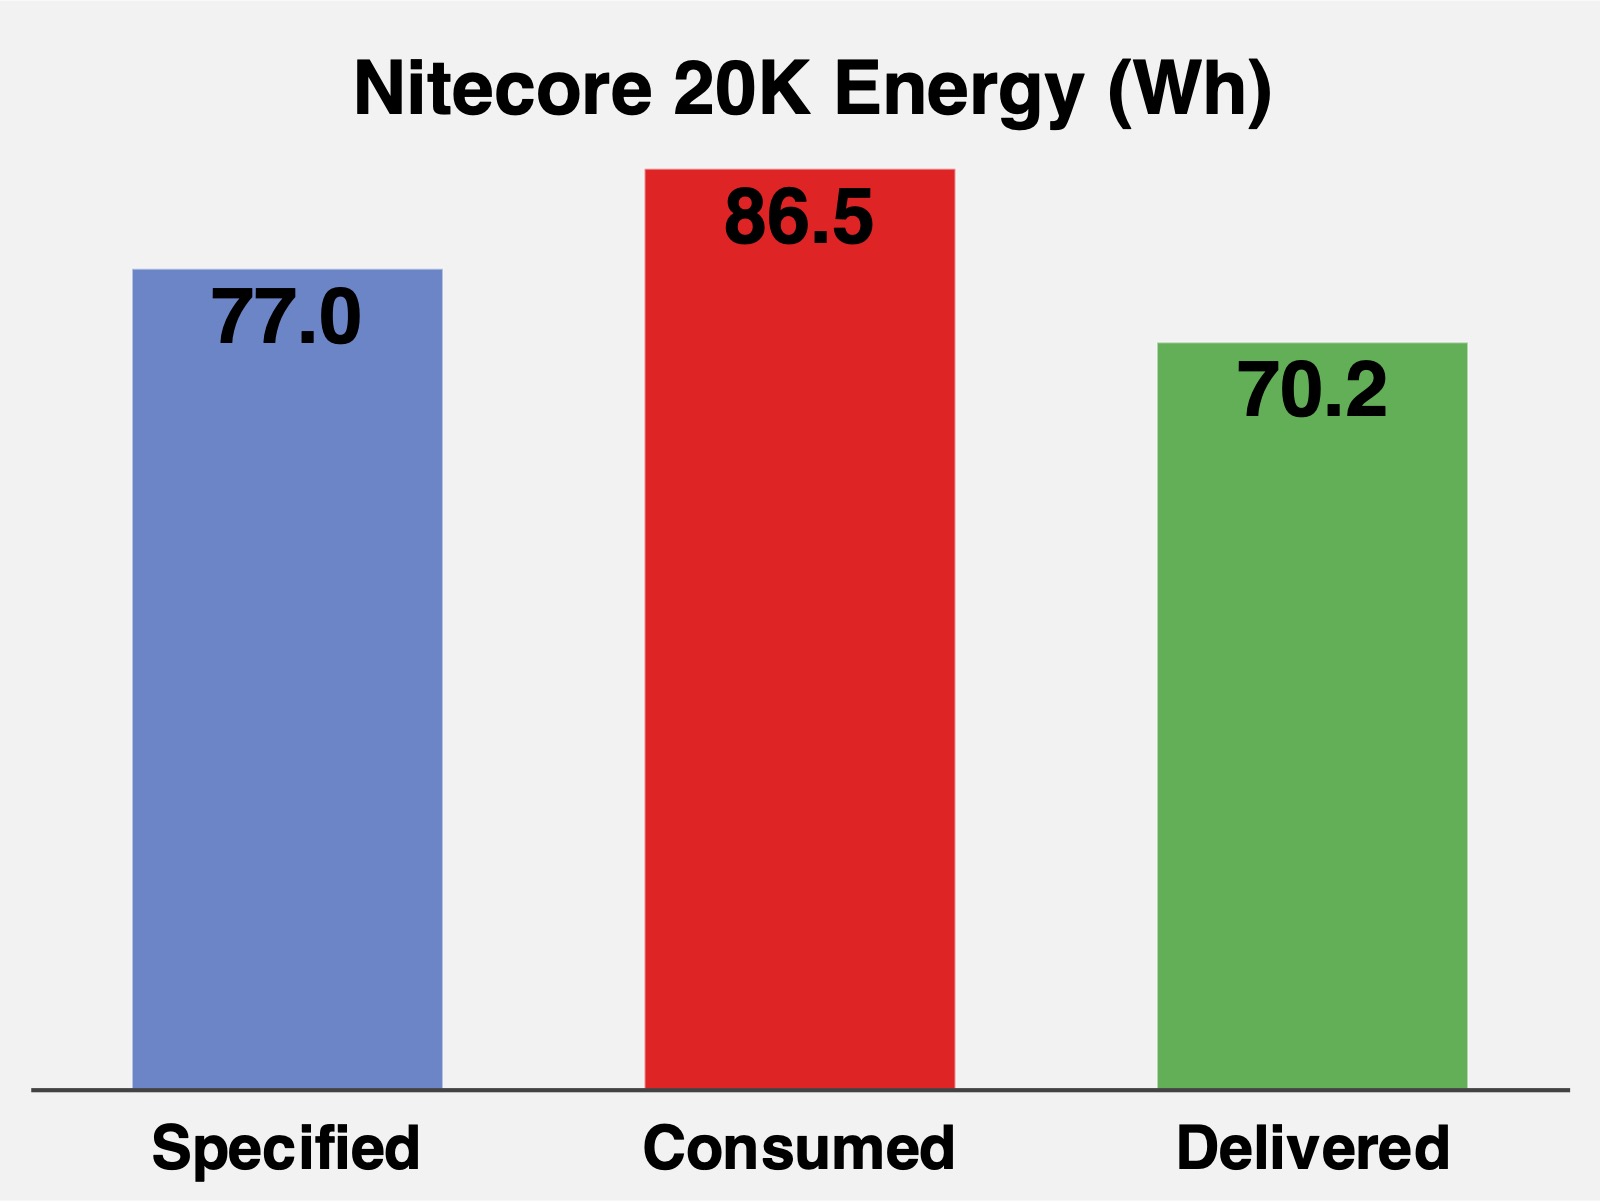
Due to recharging inefficiencies, all the PBCs consumed more energy than the manufacturer specified. They also delivered less than specified energy due to power conversion losses.
Backpackers should focus on Delivered Energy, not mAh, Specified Energy, or Consumed Energy. Some PBCs in the 20,000 mAh class can deliver up to 10% more energy than others.
Evaluating the performance-to-weight ratio of PBCs
Nitecore PBCs are lighter than Anker PBCs due primarily to the materials used (carbon fiber frame and panels on the Nitecore vs. plastic on the Anker):
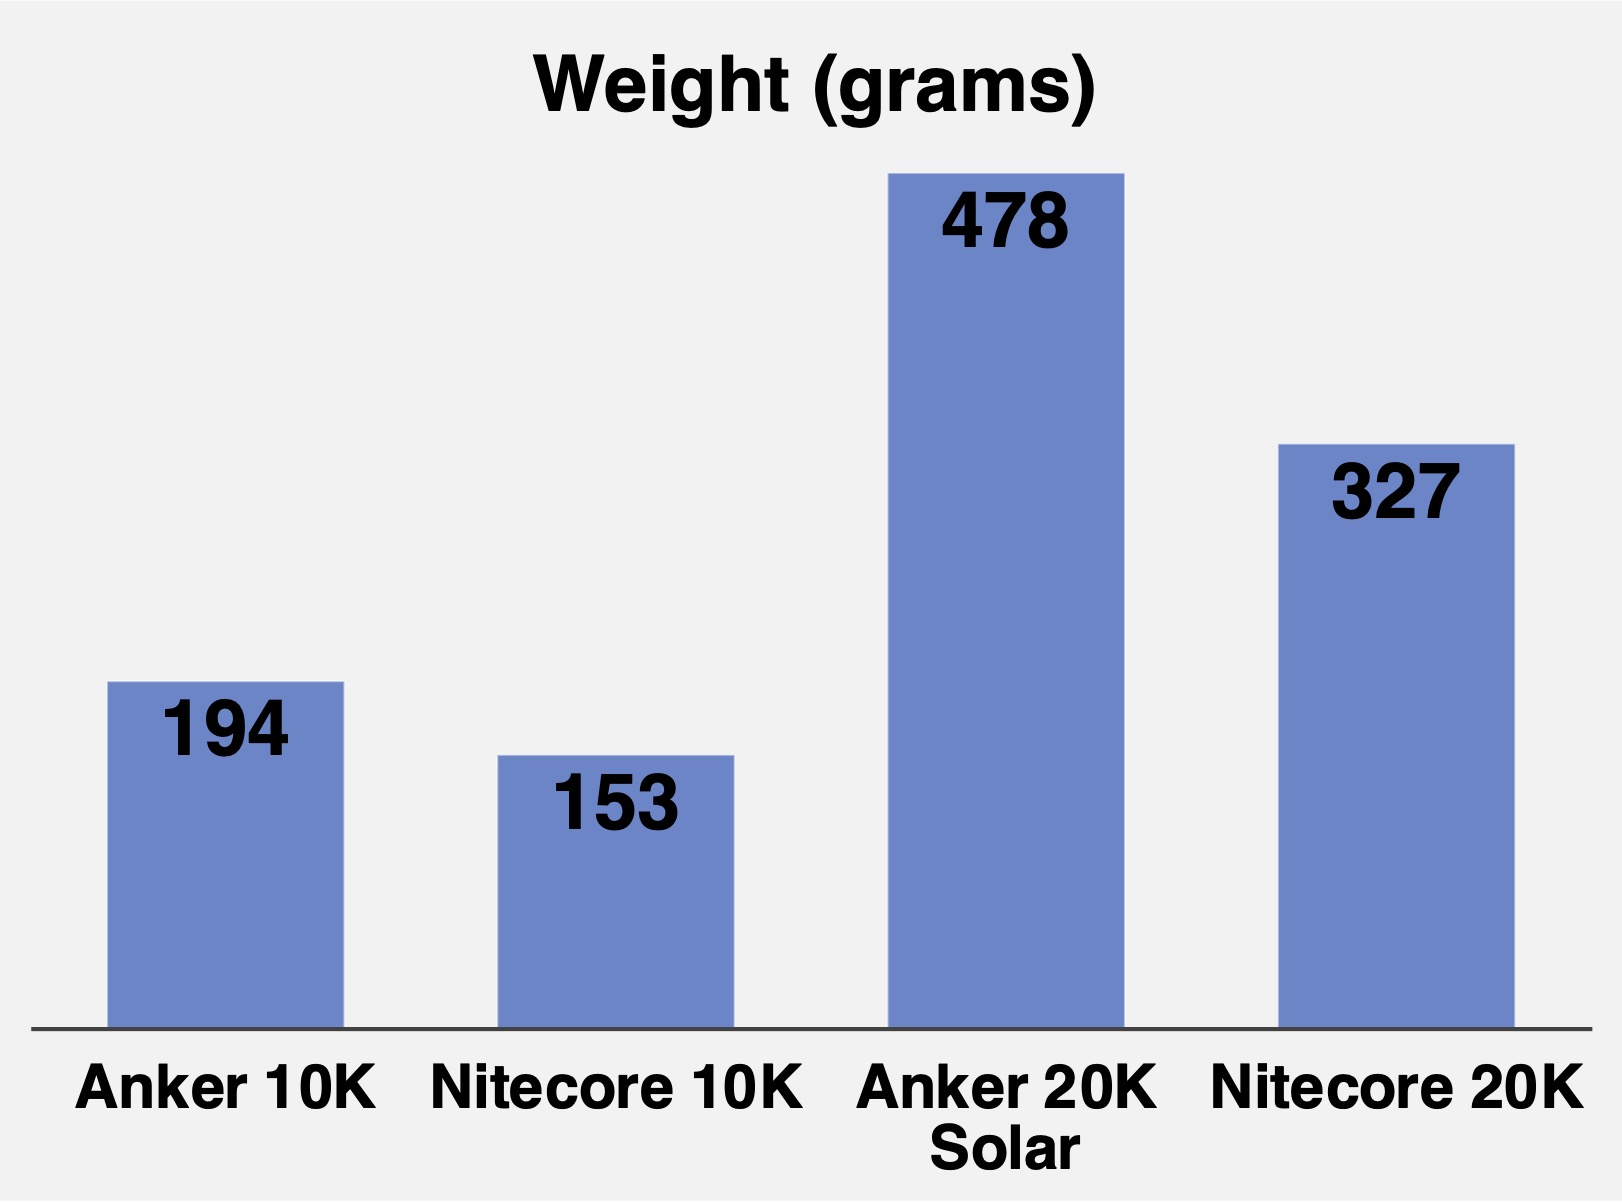
Now, to get a handle on the performance (delivered energy) to weight ratio of each PBC, consider the delivered energy of each PBC tested:

As shown above, a higher PBC weight does not mean more delivered energy. However, those extra grams might add other features like ruggedness and lighting.
So what follows might be the most important chart for gram geeks who are also watt-hour weenies or anyone else who wants to carry the lightest PBC that meets their needs. The Nitecore models stand out:

Evaluating overnight device charging performance of PBCs
Table 9: Smartphone Overnight Charging – Anker PowerCore 10000 PD Redux and Nitecore NB10000
| name | Anker PowerCore 10000 PD Redux | Nitecore NB10000 |
|---|---|---|
| new delivered energy | 24.6 Wh | 28.3 Wh |
| energy wasted | 6.2 Wh | 4.0 Wh |
| temperature during test | 64 °F (18 °C) | 61 °F (16 °C) |
Table 10: Smartphone Overnight Charging -Anker PowerCore Solar 20000 and Nitecore NB20000
| name | Anker PowerCore Solar 20000 | Nitecore NB20000 |
|---|---|---|
| new delivered energy | 61.1 Wh | 61.9 Wh |
| energy wasted | 2.9 Wh | 8.2 Wh |
| temperature during test | 59 °F (15 °C) | 61 °F (16 °C) |
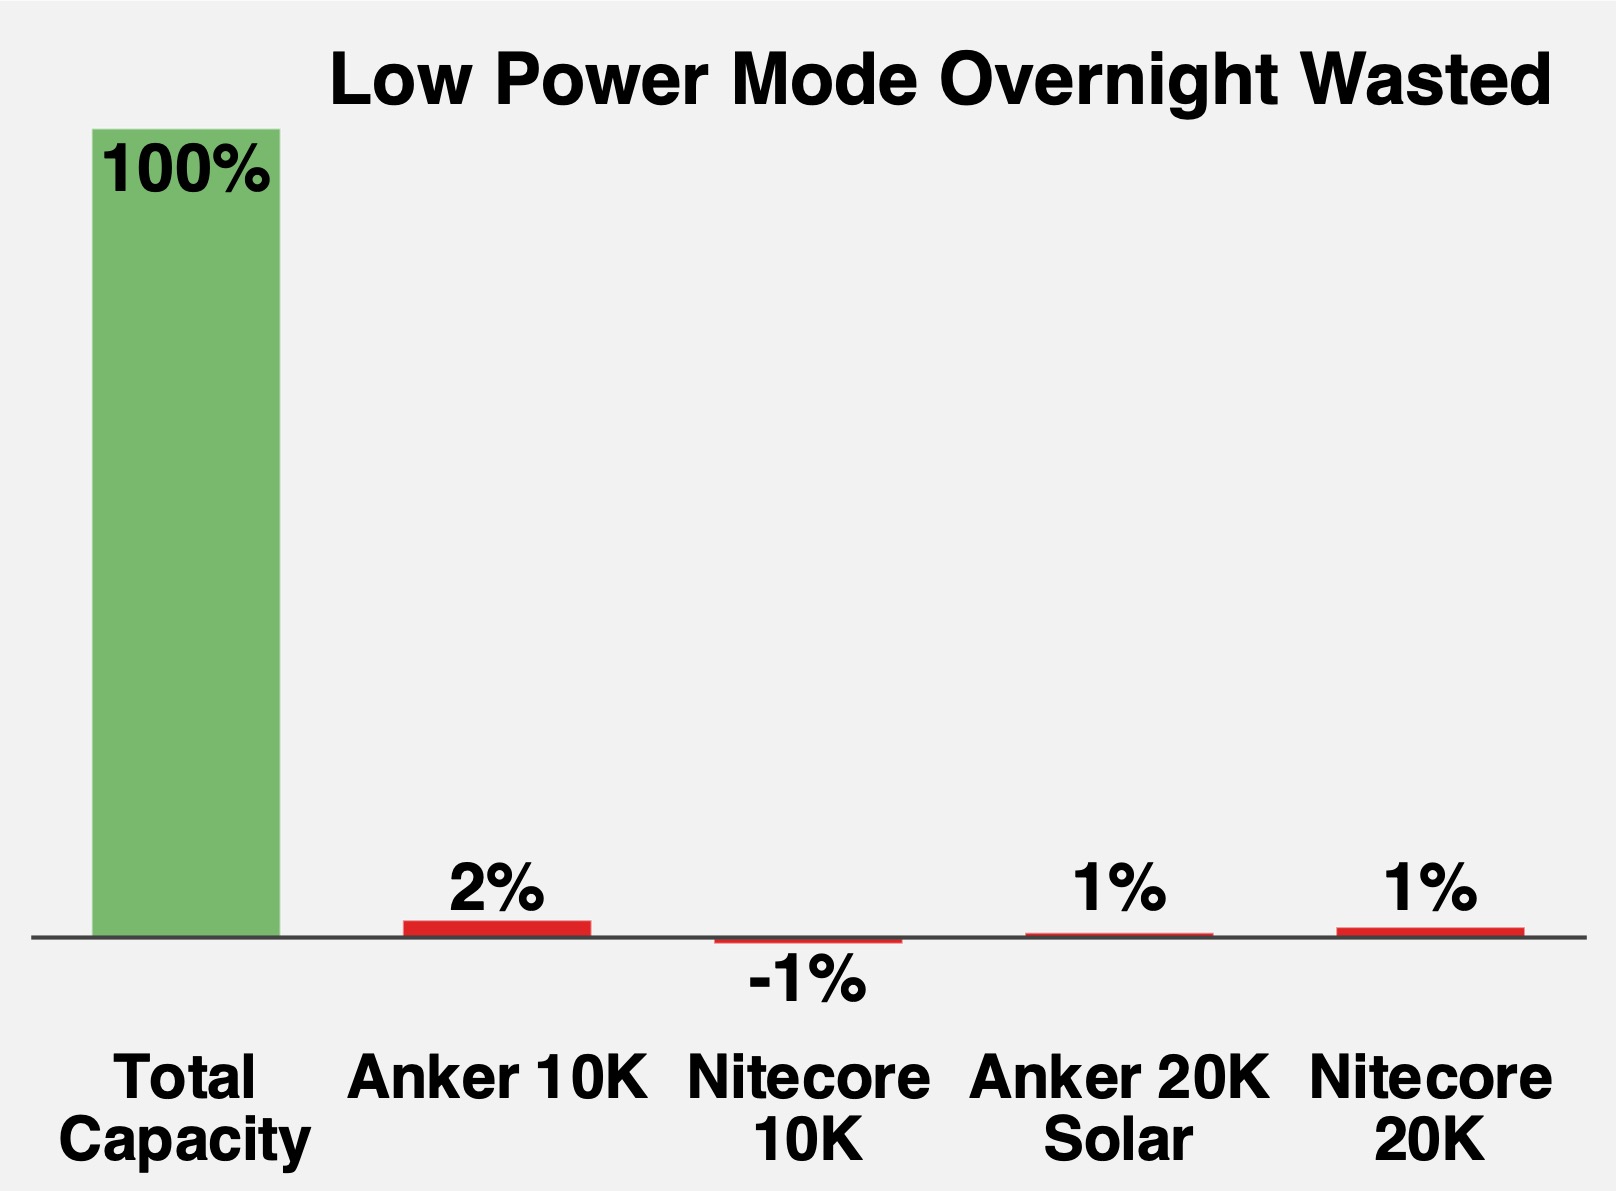
Table 11: Low Power Overnight Smartphone Charging – Anker PowerCore 10000 PD Redux and Nitecore NB10000
| name | Anker PowerCore 10000 PD Redux | Nitecore NB10000 |
|---|---|---|
| new delivered energy | 32.2 Wh | 32.5 Wh |
| energy wasted | 0.7 Wh | -0.2 Wh |
| temperature during test | 64 °F (18 °C) | 61 °F (16 °C) |
Table 12: Low Power Overnight Smartphone Charging – Anker PowerCore Solar 20000 and Nitecore NB20000
| name | Anker PowerCore Solar 20000 | Nitecore NB20000 |
|---|---|---|
| new delivered energy | 63.6 Wh | 69.3 Wh |
| energy wasted | 0.4 Wh | 0.9 Wh |
| temperature during test | 59 °F (15 °C) | 61 °F (16 °C) |
Overnight recharging an iPhone wasted a significant amount of energy on every PBC tested. It’s best to unplug your iPhone after a couple of hours.

On the other hand, using PBC low power mode overnight wasted barely any energy:
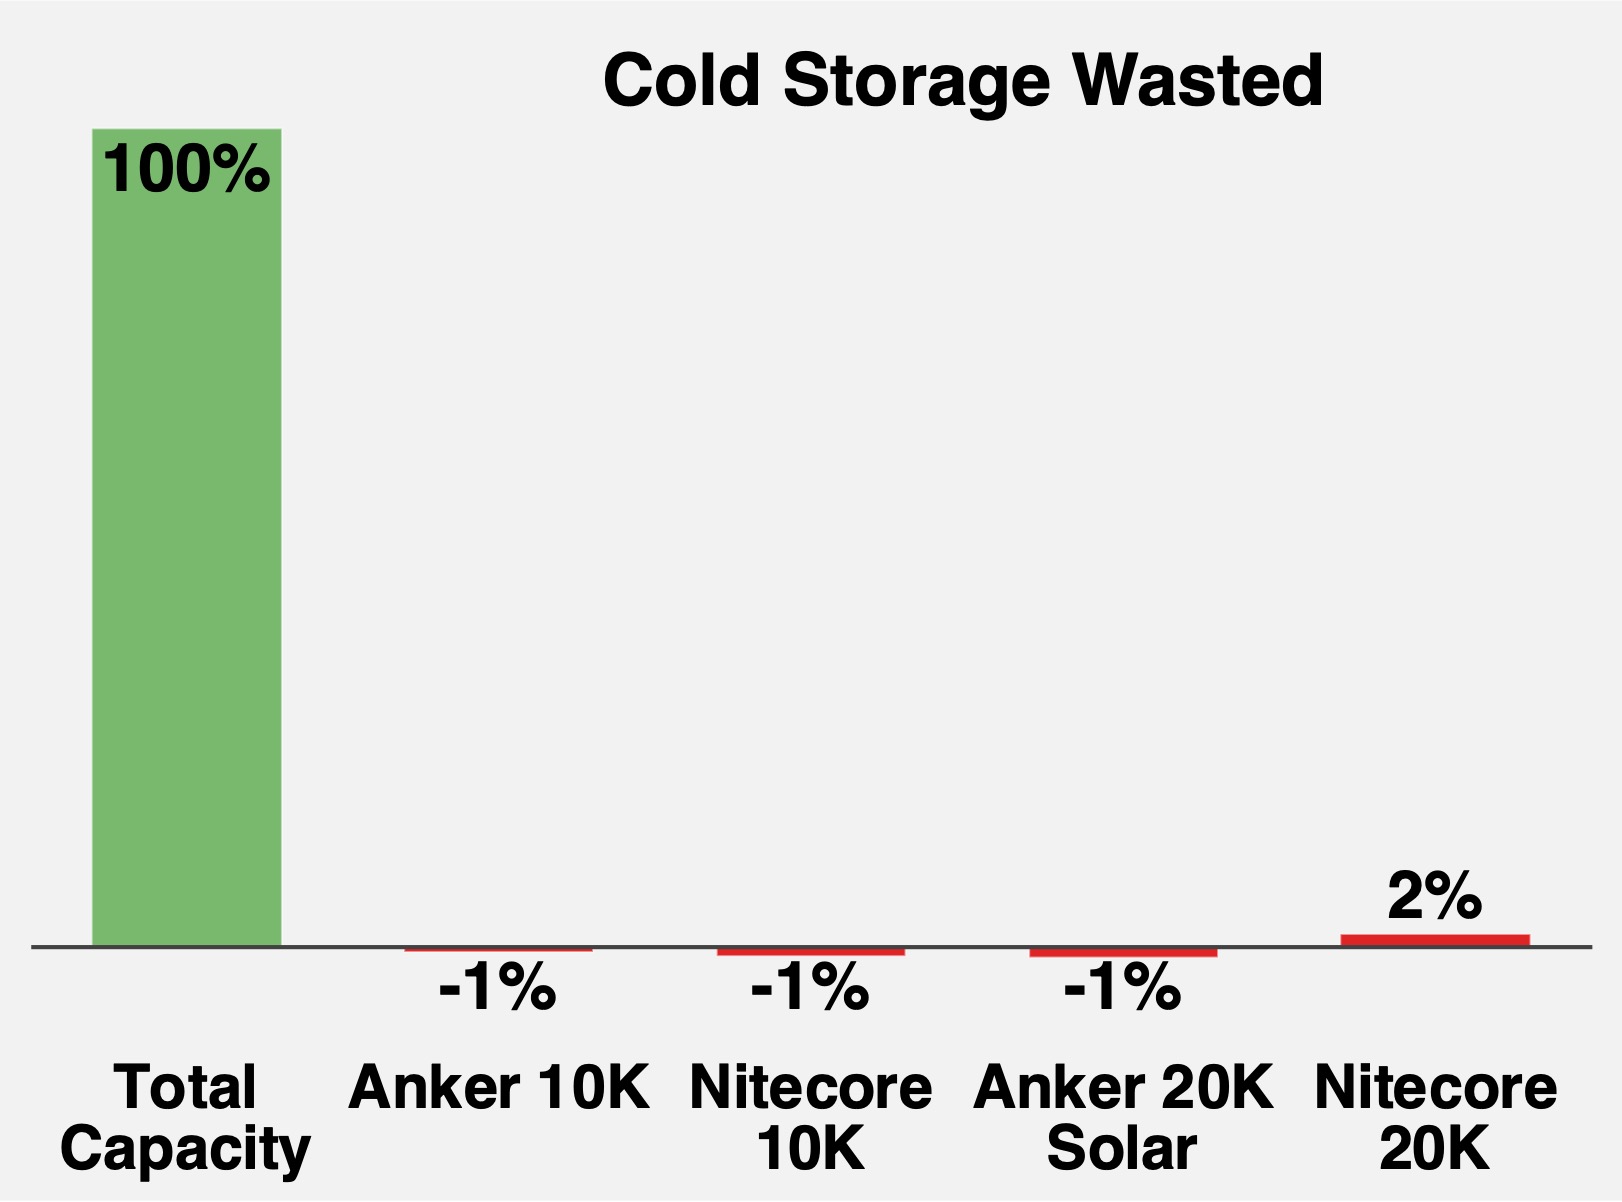
Evaluating cold performance of PBCs
Table 13: Cold Storage Performance – Anker PowerCore 10000 PD Redux and Nitecore NB10000
| name | Anker PowerCore 10000 PD Redux | Nitecore NB10000 |
|---|---|---|
| new delivered energy | 31.1 Wh | 32.7 Wh |
| energy wasted | -0.2 Wh | -0.4 Wh |
| refrigerator temperature during test | 39 °F (4 °C) | 33 °F (1 °C) |
Table 14: Cold Storage Performance – Anker PowerCore Solar 20000 and Nitecore NB20000
| name | Anker PowerCore Solar 20000 | Nitecore NB20000 |
|---|---|---|
| new delivered energy | 64.9 Wh | 69.1 Wh |
| energy wasted | -0.9 Wh | 1.1 Wh |
| refrigerator temperature during test | 33 °F (1 °C) | 33 °F (1 °C) |
Table 15: Cold Delivered Energy Performance – Anker PowerCore 10000 PD Redux and Nitecore NB10000
| name | Anker PowerCore 10000 PD Redux | Nitecore NB10000 |
|---|---|---|
| new delivered energy | 30.1 Wh | 30.9 Wh |
| energy wasted | 0.8 Wh | 1.3 Wh |
| refrigerator temperature during test | 39 °F (4 °C) | 33 °F (1 °C) |
Table 16: Cold Delivered Energy Performance – Anker PowerCore Solar 20000 and Nitecore NB20000
| name | Anker PowerCore Solar 20000 | Nitecore NB20000 |
|---|---|---|
| new delivered energy | 59.9 Wh | 67.4 Wh |
| energy wasted | 4.1 Wh | 2.8 Wh |
| refrigerator temperature during test | 39 °F (4 °C) | 33 °F (1 °C) |
There is no need to sleep with these PBCs in above-freezing temperatures:
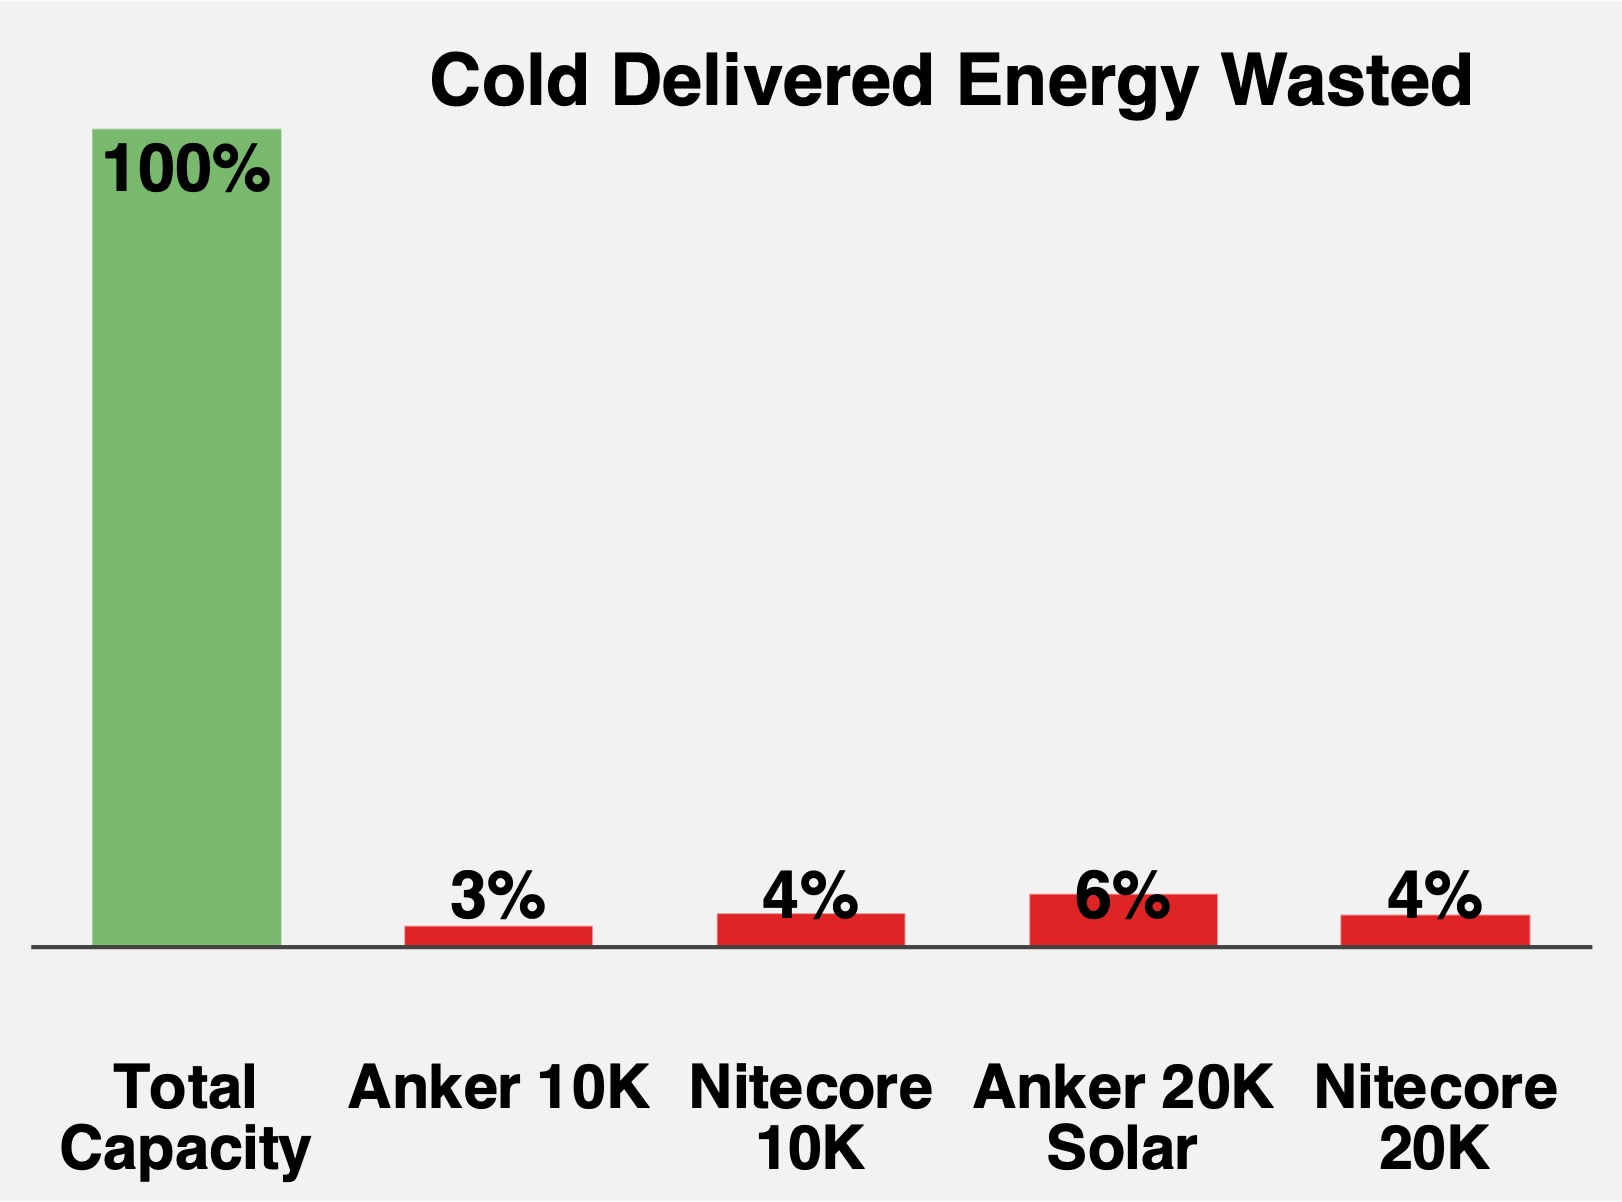
Similarly, using these portable battery chargers to recharge other devices during cold temperatures should waste very little energy. Simply follow the temperature recommendations of the PBC and device manufacturers:
Evaluating USB-A and USB-C power of PBCs
Table 17: USB-C Power – Anker PowerCore 10000 PD Redux and Nitecore NB10000
| name | Anker PowerCore 10000 PD Redux | Nitecore NB10000 |
|---|---|---|
| maximum | 18.3 W | 21.1 W |
| dropped low power after | didn’t drop | didn’t drop |
| low power mode minimum | 0.08 W, lowest on old load tester | 0.4 W, lowest on load tester |
| dropped low power mode after | didn’t drop | 15 seconds sometimes, didn’t drop others |
Table 18: USB-A Power – Anker PowerCore 10000 PD Redux and Nitecore NB20000
| name | Anker PowerCore 10000 PD Redux | Nitecore NB10000 |
|---|---|---|
| maximum | 13.0 W | 17.6 W |
| dropped low power after | 2 minutes | Didn’t drop |
| low power mode minimum | 0.08 W, lowest on old load tester | 0.3 W, lowest on load tester |
| dropped low power mode after | didn’t drop | didn’t drop |
USB-A was not designed for high-powered recharging, and these lightweight PBCs usually supplied around 13 W.
Table 19: USB-C Power – Anker PowerCore Solar 20000 and Nitecore NB20000
| name | Anker PowerCore Solar 20000 | Nitecore NB20000 |
|---|---|---|
| maximum | 18.3 W | 21.1 W |
| dropped low power after | didn’t drop | didn’t drop |
| low power mode minimum | 0.08 W, lowest on old load tester | 0.4 W, lowest on load tester |
| dropped low power mode after | didn’t drop | 15 seconds sometimes, didn’t drop others |
Table 20: USB-A Power – Anker PowerCore Solar 20000 and Nitecore NB20000
| name | Anker PowerCore Solar 20000 | Nitecore NB20000 |
|---|---|---|
| maximum | 12.8 W | 14.3 W |
| dropped low power after | didn’t drop | didn’t drop |
| low power mode minimum | 0.3 W, lowest on load tester | 0.4 W, lowest on load tester |
| dropped low power mode after | didn’t drop | didn't drop |

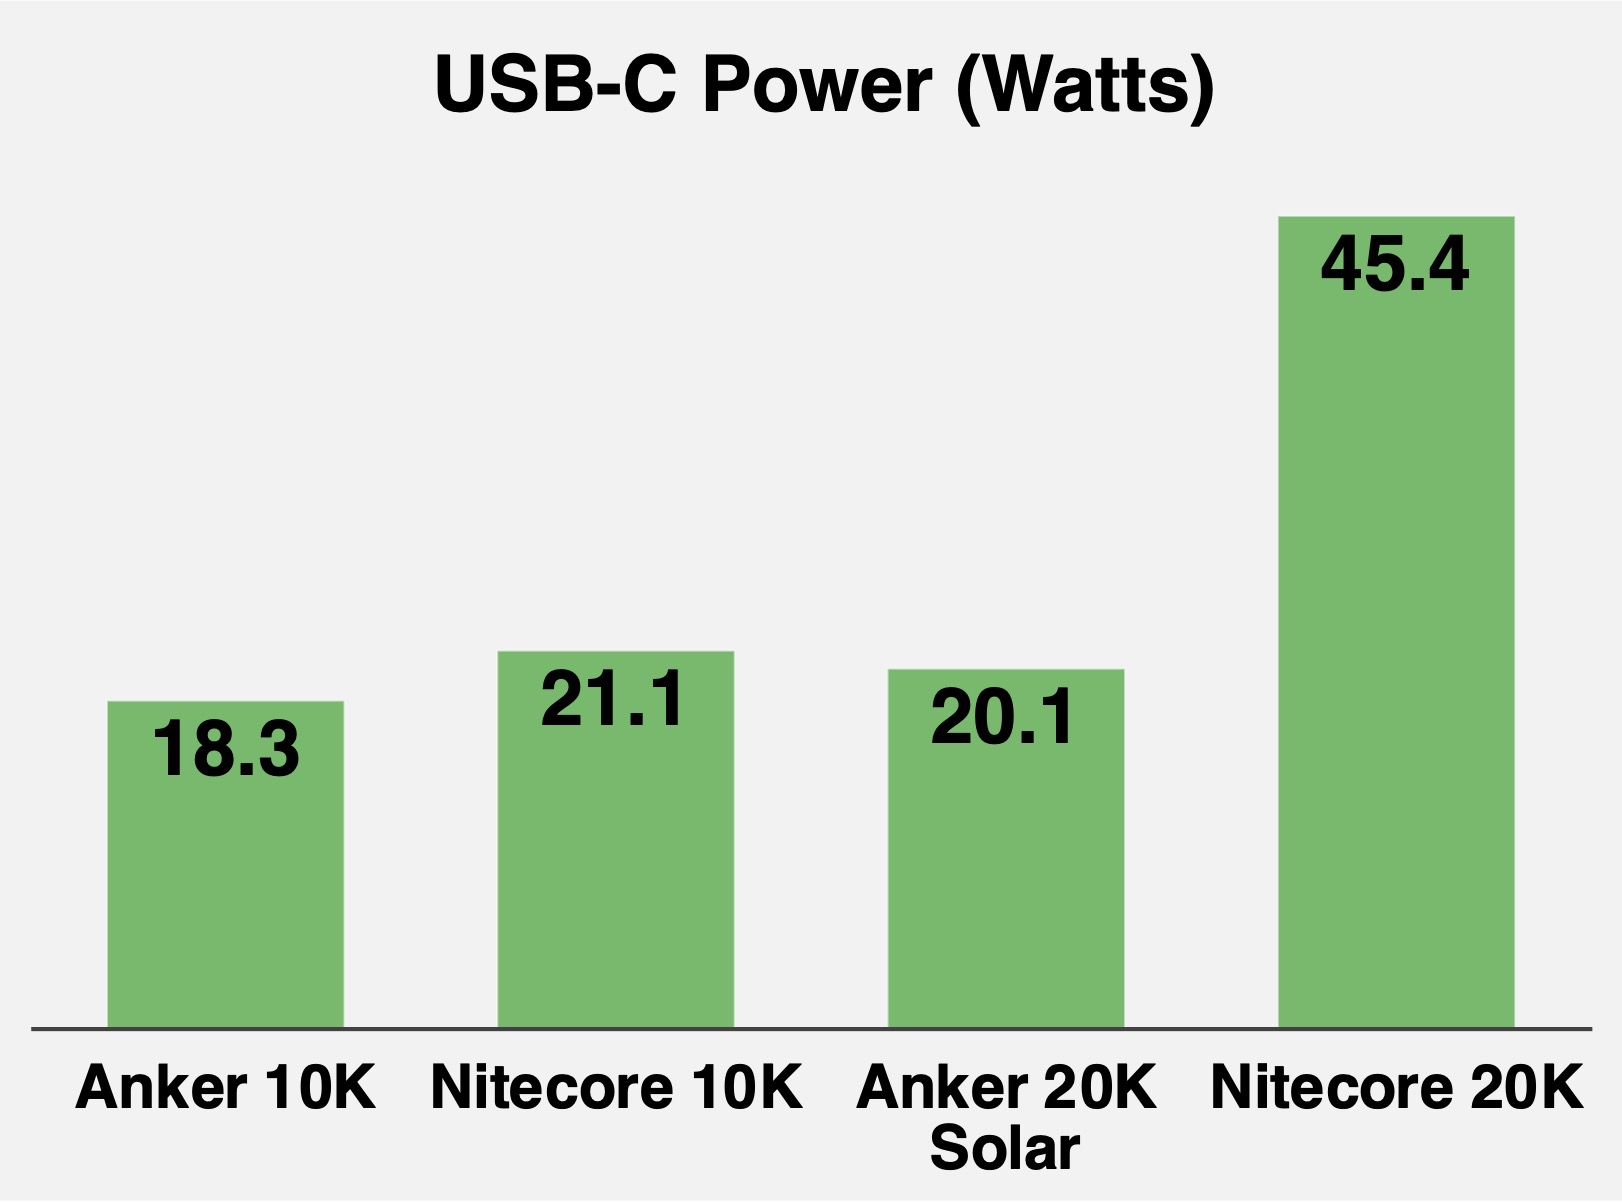
Three PBCs tested a specified 18 W of USB-C output and delivered a little more. The Nitecore NB20000 goes to 45, but can your devices consume that much power?
Evaluating recharge time of PBCs
Some portable battery chargers recharged significantly faster than others. This feature is mainly of interest to thru-hikers during town stops.
Table 21: Recharge Time – Anker PowerCore 10000 PD Redux and Nitecore NB10000
| name | Anker PowerCore 10000 PD Redux | Nitecore NB10000 |
|---|---|---|
| elapsed time | 4.6 hours | 4.0 hours |
| energy consumed | 39.4 Wh | 43.9 Wh |
| energy wasted | 8.5 Wh | 11.6 Wh |
| temperature during test | 66 °F (19 °C) | 63 °F (17 °C) |
Table 22: Recharge Time – Anker PowerCore Solar 20000 and Nitecore NB20000
| name | Anker PowerCore Solar 20000 | Nitecore NB20000 |
|---|---|---|
| elapsed time | 7.1 hours | 5.4 hours |
| energy consumed | 82.9 Wh | 86.5 Wh |
| energy wasted | 18.9 Wh | 16.3 Wh |
| temperature during test | 61 °F (16 °C) | 63 °F (17 °C) |
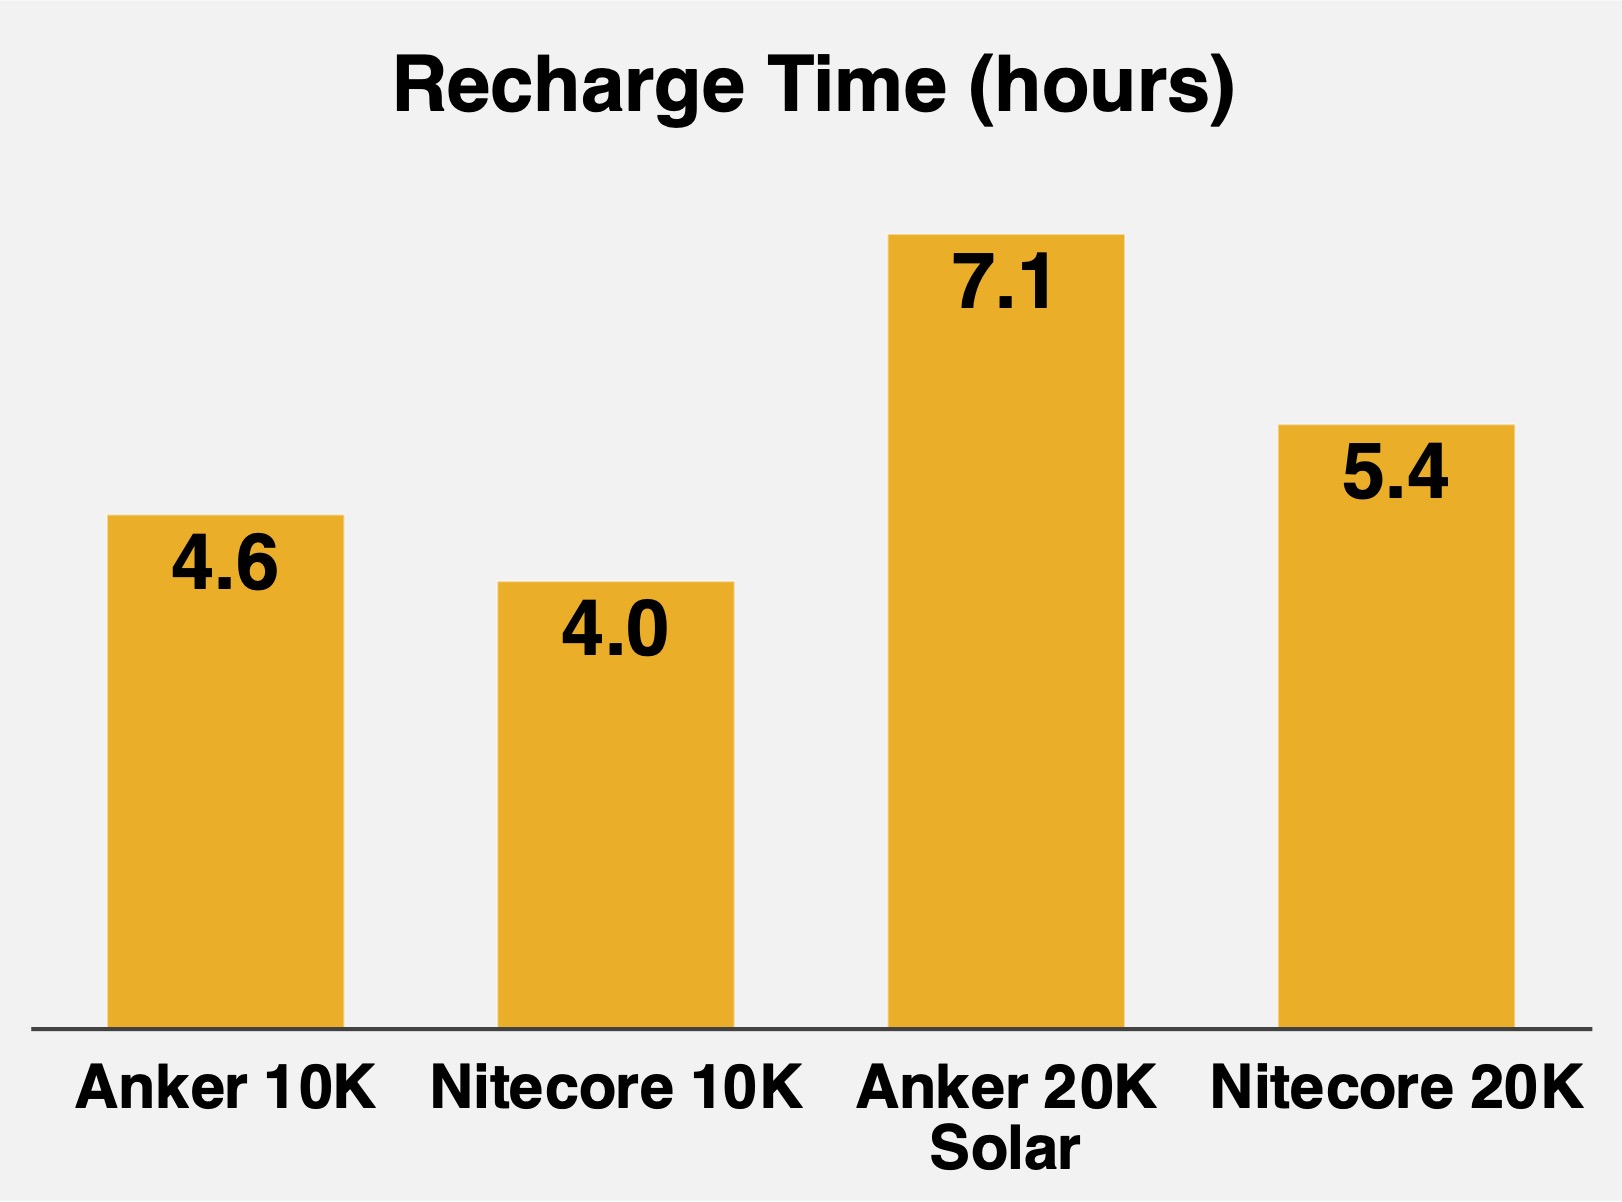
Table 23: Solar Recharge – Anker PowerCore Solar 20000
| name | Anker PowerCore Solar 20000 |
|---|---|
| date | 12/18/2021 |
| latitude | 36.98° north |
| tilt angle used | 30° |
| ambient temperature | 53 °F (12 °C) |
| new delivered energy | 1.8 Wh |
| solar power | 0.9 W |
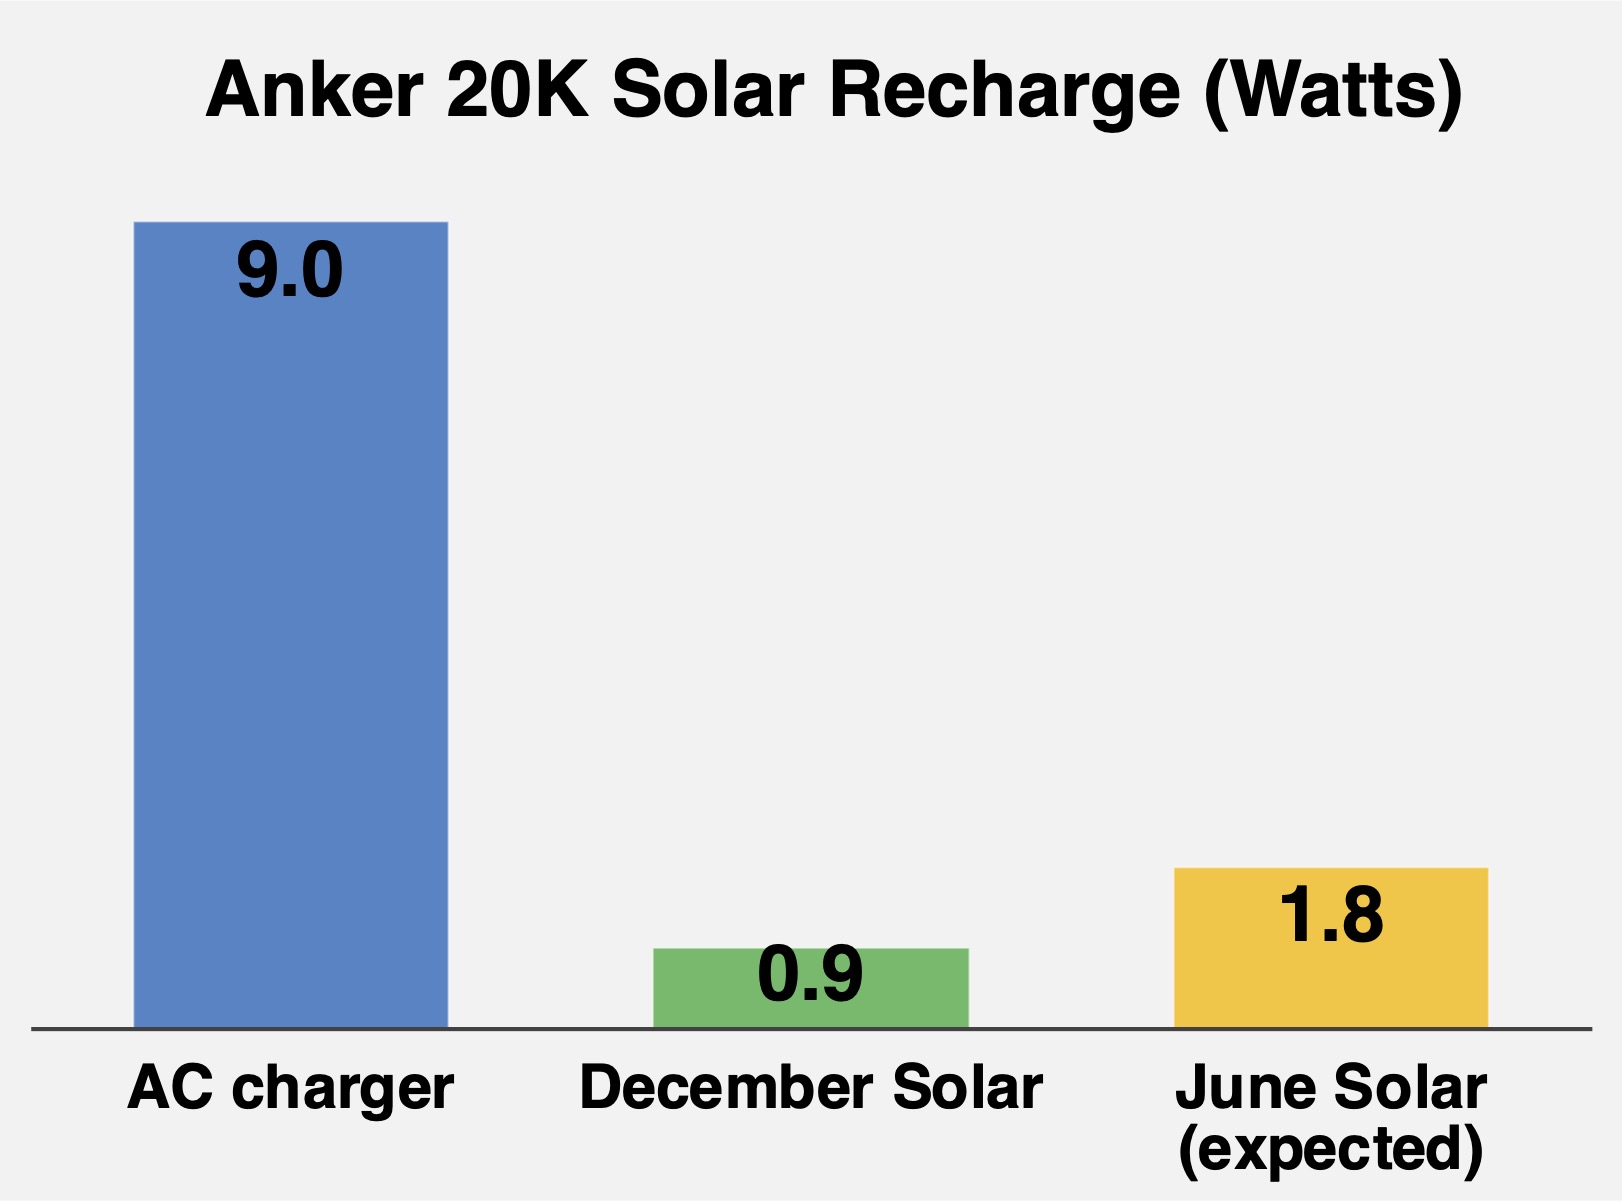
The Anker PowerCore Solar 20000 portable battery charger manual and web page says:
“Solar charging is subject to sunlight intensity and panel conversion rate, so it may take several days to recharge PowerCore Solar. It is recommended to fully charge the battery if you plan on going on a lengthy trip.”
I measured 1.8 Wh of energy added to the battery in two hours of winter noon direct sunlight. During June, it might charge twice as fast (but only with clear skies and no shade, and while always pointed in the optimal direction). Even under optimal summer conditions, it would take more than a week for an empty Anker PowerCore Solar 20000 to recharge fully.
Recommendations
Most of us own outdated, underpowered, or obsolete portable battery packs. Do we need to discard them and replace them with state-of-the-art models? First, consider simple and cheap hacks to get by for now:
With needs that vary greatly and in a rapidly changing market, a “best” portable battery charger simply does not exist. Furthermore, if it did (on paper), its crown will dissolve in a relatively short amount of time. That means a consumer can spend an enormous amount of money making sure they own the best PBC at any given time. That is a fool’s game. Instead, buy the most capable PBC you can afford now and use it as long as you can. Our landfills are full enough of electronic waste.
Here are the PBCs that have been tested with BatteryBench and show the highest numbers that are here today – but might be gone tomorrow.
Highest delivered energy density
It is practically a tie between the two Nitecore portable battery chargers. The others tested weren’t even close. Nitecore PBCs were 25 to 38% more energy-dense than Anker PBCs. Almost all the PBCs I evaluated (based on specifications provided by the manufacturer) but didn’t test in this report had a lower Specified Energy density. And Specified Energy was always significantly higher than Delivered Energy.
Highest performance
At 45 W for recharging other devices, the Nitecore NB20000 is more powerful than most lightweight PBCs. Plus, power-hungry thru-hikers could pair the Nitecore NB20000 with a lightweight 30 W AC charger for even faster recharging. In addition, both Nitecores have that carbon-fiber cool factor guaranteed to make you the envy of all your backpacking buddies. But buyer beware, don’t assume that carbon-fiber-cool alone reveals unabashed consumer intelligence.
The shallow, fragile USB ports on Nitecore carbon fiber PBCs are worrisome. Users must avoid sharp impacts. Keep the USB ports and cable connectors clean, and blow them out regularly. Consider putting inexpensive, lightweight dust plugs in the ports.
Like most ultralight products, Nitecore carbon fiber PBCs should be handled with care. After you drop a Nitecore carbon fiber PBC, make extra sure that cables are firmly inserted into the USB ports. You might want to re-insert a few times, then periodically check that recharging is normal.
On the NB20000 I tested, the USB-C input-only port was dead, which didn’t seem to affect any test results. It’s hard to say if Nitecore has consistent quality problems based on a sample size of only two units.
Selection advice
Maybe you don’t want to become a watt-hour weenie. To help choose the perfect portable battery charger, I could create complex formulas based on test results, hard-to-find specifications, and lots of assumptions.
Nevertheless, PBCs are available in just a handful of energy capacity classes. If you don’t want to run out of energy on a backpacking trip, take a PBC that is one size up from what you need. As stated in BatteryBench:
You need experience with your gear on your trips to judge how much PBC capacity you require. Previously, Ryan Jordan published empirical guidance in this article’s “Charging Batteries” section if you don’t want to dive into PBC testing.
Finally, in dollars or grams, don’t pay extra for a portable battery charger with built-in solar cells. One Backpacking Light community member found that a larger solar panel attached to a smaller PBC worked well. Recharging from the sun with such a small panel is almost worthless.
Conclusion
When this article was written, the Nitecore NB10000 and NB20000 portable battery chargers seemed to be the highest-performing models available, though they have had some issues. Testing isn’t that hard if you are determined to find the best PBC that meets your needs.
After examining these four portable battery chargers with a comprehensive suite of tests, I know I could get enough data needed to make a good decision based on a limited BatteryBench protocol. The tests I would perform would be Physical Measurements, USB-A Power, USB-C Power, Delivered Energy, Recharge Time, and Drop Tests. Moreover, you could realistically complete that short list in about one day instead of 11.
Learn more
Browse our curated recommendations in the Backpacking Light Gear Shop – a product research & discovery tool where you can find Member gear reviews, Gear Swap (used gear) listings, and more info about specific products recommended by our staff and members.
Gear Shop » Navigation and Electronics
Related Content
- read more by Rex Sanders
- read Drew Smith’s field test review of the Nitecore NB10000
DISCLOSURE (Updated April 9, 2024)
- Backpacking Light does not accept compensation or donated/discounted products in exchange for product mentions or placements in editorial coverage. Some (but not all) of the links in this review may be affiliate links. If you click on one of these links and visit one of our affiliate partners (usually a retailer site), and subsequently place an order with that retailer, we receive a commission on your entire order, which varies between 3% and 15% of the purchase price. Affiliate commissions represent less than 15% of Backpacking Light's gross revenue. More than 70% of our revenue comes from Membership Fees. So if you'd really like to support our work, don't buy gear you don't need - support our consumer advocacy work and become a Member instead. Learn more about affiliate commissions, influencer marketing, and our consumer advocacy work by reading our article Stop wasting money on gear.

Discussion
Become a member to post in the forums.
Companion forum thread to: BatteryBench Tests of Nitecore and Anker Portable Battery Chargers
Anker Powercore PD 10000 and PD 20000 and Nitecore NB10000 and NB20000 carbon fiber portable battery chargers are put through the BatteryBench testing protocol.
Interestingly enough, Nitecore has release Gen 2 of their NB10000.
@Breau – when you say “released” do you mean “announced”? I have not been successful in locating a Gen2 NB10000 for actual sale. The Nitecore store does not have them and shows the Gen1 as out of stock.
@JCH I do. I haven’t purchased one or found it for sale.
So, if I’m looking at the picture of the business end of the Nitecore and wondering if I would be able to remember how to work that at then end of a long day, the Anker 10000 isn’t that much heavier for just a touch less power?
It’s not hard to operate. You plug stuff in and hit the button. If you want to charge a low power device you press and hold the button until it turns white. It’s pretty easy. YMMV
I’ve had trouble with a past one charger, no one of these brands, so I might be overly concerned. You have to have the cord exactly right to get a connection and hit the single button the right number of times. I find it confusing.
Seems like way too many charts.
Some of he charts indicate that 2 Anker 10000s are better than 1 Anker 20K
What is the chemistry of the Nitcore?
In addition to the NB10000 Gen2, Nitecore will also release the new NC10000 PBC this summer. Slightly lower energy density than the NB10000, but different form factor that might be more attractive to some. USB-C only (1 port). Built-in flashlight. And automatic low power device detection.
It’s not that hard to figure out how to use the Nitecore 10000 even when tired. Actually, you can turn low power mode on before you set out and it will keep that mode. I almost always use low power mode with the Nitecore because my iPhone gets quite hot with the “normal” power mode.
Regarding remembering how to use Nitecore (and other) products, I download the .pdf version of the user manuals to my phone.
Right, but as mentioned in the article, if your phone has no power, it doesn’t matter what you have loaded on it. Obviously, you should never deliberately let your phone get to zero power for many reasons, but if it ever does, that’s when you need the charger most.
Anyone else noticed their NB1000 won’t charge devices when it’s temperature is 32-40F? It will light up as if it’s delivering a charge but the device being charged-regardless of it’s temp. won’t actually be charging. Had my warmish iPhone plugged into NB1000 that sat under vestibule at 32F. After 45min my iPhone increased charge by 0%.
So, part of this test really caught my attention, because I need to replace a worn-out unit with something newer and I need it to work at cold temps:
What about below-freezing temps? PBCs are something that I don’t know a lot about, to be honest; does cold – like, legit-cold – impact them significantly? I was going to get an Anker 525, but now I wonder if I need to do more research.
Anecdotal evidence only:
Visiting Urbana IL several winters ago, I left the house with my phone at 100% charge. Being a lifelong Floridian, I put the phone in my front pants pocket as usual. The high that day was 16F. Within 3 hrs the battery was at 15%…in my pocket…unused. My wife and daughter’s phones, in their purses, were dead. I suspect the little bit of warmth my thigh provided accounted for the difference.
Granted, this experience with the battery in the iPhone may or may not be applicable to PBCs, but I suspect it could. I always carry my PBC buried deep within my clothing layers when temperatures are below 30F.
I’ve never had that trouble with a phone in my front pocket. My leg generates enough warmth. But the battery will drain pretty quickly if I use my phone in that kind of weather. Fortunately, Pittsburgh doesn’t really get the midwestern cold winter.
For many years I’ve owned two PBCs that were given to me. One is 4,000 mAH and the other is 10,000 mAH. That’s good enough for my car camping/hunting uses. I never take them backpacking B/C I carry extra batteries for my camera, GPS and rescue beacon. (3 batteries total) which weigh a lot less than my 10,000 mAH PBC.
Fantastic work, thanks.
I have 2 Nitecore NB10000 (2 of them weight less then 1 Nitecore NB20000!) and NB20000 itself. Also I had Anker 20000.
I used Nitecore for several long and cold hikes from November 2021 and can share some experience.
1. Never use Nitecore for overnight charging. I lost all power in one unfortunate night forgetting turn off my Samsung S22 (save battery mode on) , it sucked all in 1 night.
2. Always use low power mode for things like Garmin watches, head lamps, Inreach Mini etc.
3. Nitecore banks are wasting power being in storage much faster then Anker
4. Nitecore has very low humidity resistance.
5. I completely bricked NB20000 in my last hike in Peru using a standard Samsung USB charger in a hostel due a overheating (the both USB outlet charger and the unit became very hot in several minutes). The reason is still unclear: fault unit, fault design or using in cold and humid. Try to check your charger before the trip.
What is “humidity resistance” ???
Thanks to previous articles I have stopped charging all devices at night due to wasted energy. With this testing of low power mode not wasting much if any-I will try this out. Thanks Rex.
Never mind, I realized low power mode stop power wasting on small devices-earbuds, etc. not phones.
Nitecore just released their Gen 2 10000 mAh charger lowering the weight from 5.3 oz to 5.29 oz. While I’d skip on the weight savings, maybe there’s some other improvements?
Meanwhile I’ll keep lugging my 6.8 oz Anker with The Rolling Stones cover tune “Beast of Burden” going through my head..
https://youtu.be/761yzGz4HzQ
Just ordered one. Just for the LED update alone.
Well got my hands on the NB10000 Gen 2. The LEDs very easy to read now. I also like the yellow outline around both ports. Weight is the same. Mine came above spec at 155g. What has not improved and maybe has gotten worse is the accuracy of the LEDs. I drained the bank-made sure of it. Plugged it into my 20W Anker Nano(511) using USB-C to USB-C. Within 20 minutes the first LED was solid and the second was blinking. At 40 minutes in the second LED was solid and the third blinking. Finished charging at 3h 20minutes. I have a hard time believing it was at 66% capacity in 40min.
I have never seen Anker have out of whack status LEDs like this. Anyone else notice this?
you could measure it
after you charge it to “66%”, quit charging and then plug something in and measure how much power it delivers. Repeat with 100% charge.
They do charge quickly to something like 66%, then a lot slower to charge the rest of the way
Become a member to post in the forums.