Background
I worked in the 3D printing industry for many years: actual jetting of material (not dispensing molten material through a single nozzle). We were using a 300 dot per inch printhead to generate solid objects and the printhead contained 1200 nozzles. Building a single 8” tall object was equivalent to printing 5000 pages.
Supplying the printhead with clean material was paramount to printing reliability as well as longevity. To assess this issue, a metric was developed to evaluate jetted material for cleanliness. This is called Conductivity Testing. To conduct the test, liquid was placed into the test apparatus and the fluid level was held at a constant level - this would provide a uniform fluid pressure. Downstream from the vessel was a standardized filter material. The liquid was allowed to flow through the filter and the data was collected. To generate a Conductivity Chart, you plot the real-time flowrate of the liquid through the filter material (Y-axis) against the total amount of fluid that had passed through the filter (X-axis). The chart would look like a straight line with a negative slope: high on the left side and diminishing on the right.
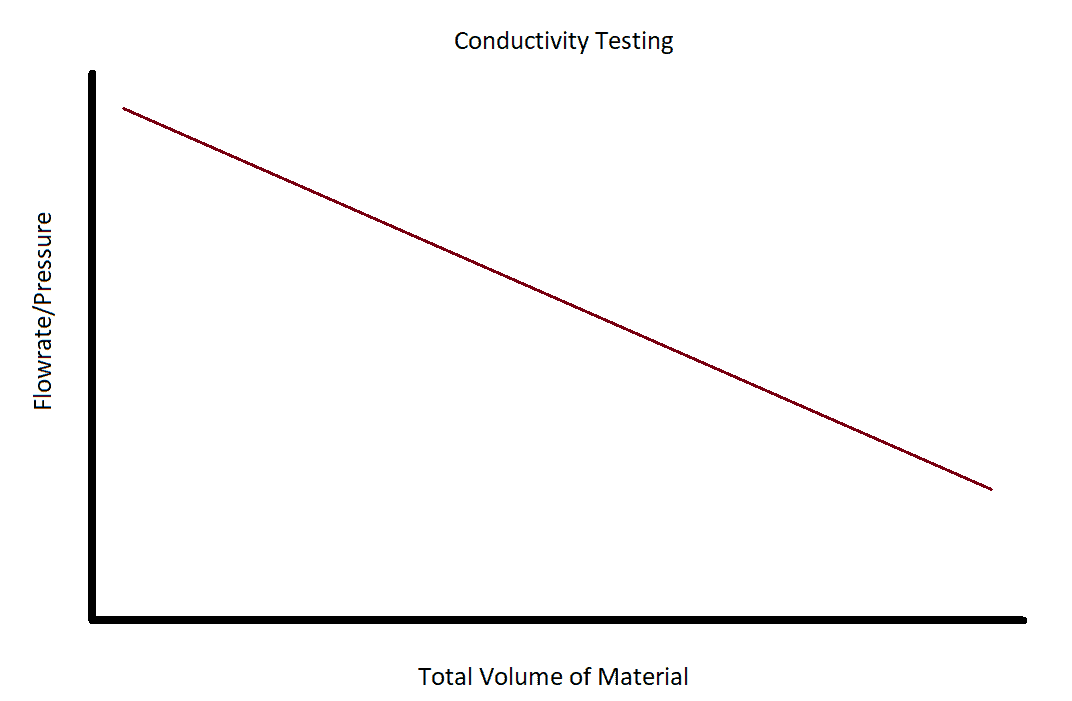
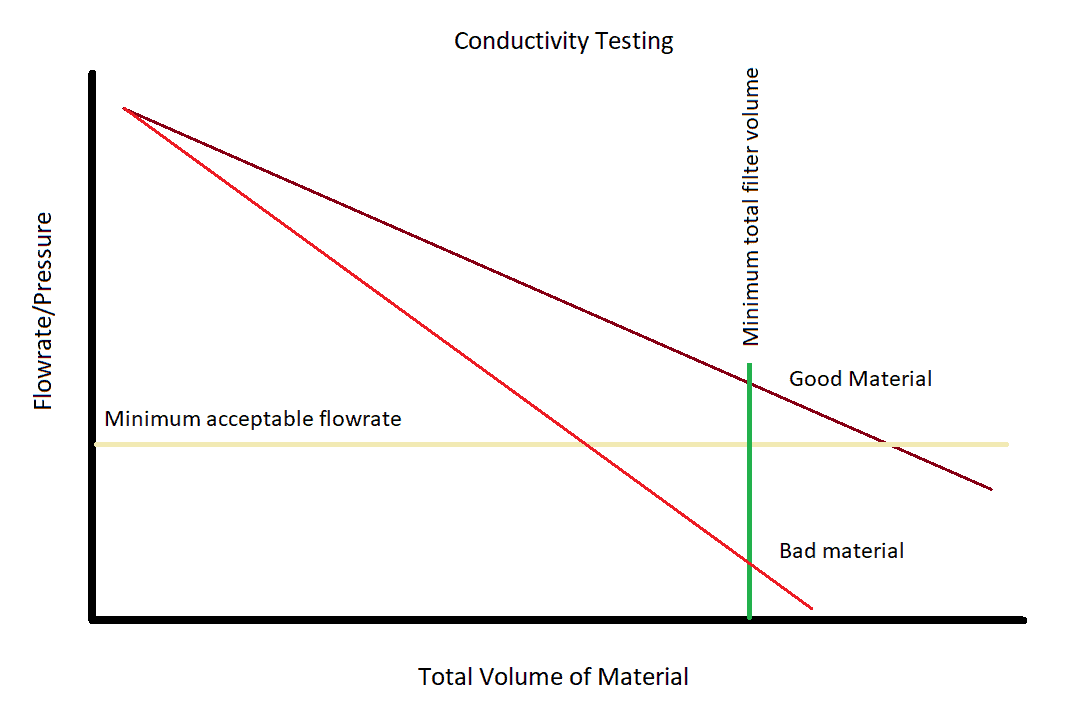
The slope of the line would give us the rate at which the filter clogged or in other words, a measure of the material cleanliness. The minimum flowrate is defined by performance requirements needed to jet material correctly. The total volume of material jetted is defined by marketing requirements. From this chart you can determine how many cubic feet (or pounds) of material could be jetted before the flowrate drops below acceptable levels.
The test metric is excellent for verifying material cleanliness, so we can apply this to estimate backcountry water filter performance.
However, we have no control over water quality in the backcountry. Modifying the test methodology to estimate effective filter area does add a lot more value to help characterize the performance state of the water filter.
It would be easy to replicate this type of test for water filters and the results would be highly repeatable. That being said, the system we used for evaluating 3D printing material quality, described above, is bulky and requires additional equipment that would make it difficult for most backpackers to emulate.
Thus, in this article, I am proposing a faster and easier-to-use test that, while not as accurate, the would be easy to replicate and is user friendly enough for most backpackers.
The goal of this test is to determine the effective age of your backpacking water filter based on comparing its current flowrate to its flowrate when new.
Word Count: 2000+Member Exclusive
A Premium or Unlimited Membership* is required to view the rest of this article.
* A Basic Membership is required to view Member Q&A events

Discussion
Become a member to post in the forums.
Companion forum thread to: Estimating the Age (Lifespan) of Your Backcountry Water Filter
The goal of this test is to determine the effective age of your backpacking water filter based on comparing its current flowrate to its flowrate when new.
Hi Jon,
Thanks for the detailed background and analysis. Would be great to gather more data across several filters and filter models, but that requires a lot of work.
It seems like filters more-or-less gradually decline until (a) they stop working entirely or (b) I get too frustrated with the flow rate and decide to buy a new one. Generally, I try filtering some tap water just before each trip to make sure it still functions acceptably, and hope for the best. Maybe tracking flow rates with a repeatable scheme like yours would help me forecast that replacement date more accurately, and prevent backcountry surprises.
— Rex
Jon,
Great article. I don’t think I’m up to tracking the flow rates of my BeFree, but in the future I think I will:
Casey
I believe that if this community got together to measure the performance of brand new water filters it would establish a good database. Sawyer, BeFree, whatever. I suspect the measurements of new filters will be very repeatable. After that, everyone could get a sense of the remaining filter life of their respective filters. At the heart of this is the UL concept of reducing redundancy via smart decision making. With my 5 year old filter, I was flying blind until I got the data. My 2 Cents
<p style=”padding-left: 40px;”>I find it interesting that most backpackers will backlash their filters, which is what the manufacturer recommends and what I did for years. While hiking thru the 700 miles of New Mexico on the CDT, I started soaking the filter in warm water (110*-120*F) for 20-30 minutes, shaking it out, then backflush for better results.</p>
I just got back from 2 weeks on the JMT and used a 2-year old Sawyer Squeeze. For this trip, I switched from using the Evernew 2L bags to the CNOC Vecto 2L bags, because the Vecto bags have a clip that can be removed to completely open the back end of the water bag. This makes it much simpler to fill the bag, particularly in standing water.
However, I wasn’t very happy with the performance results. When I would roll the CNOC bag like a toothpaste tube and put pressure on the bag, the flexible silicone like material would bulge rather than directly transfer all of my exerted force into water pressure. The result was that I felt it took me longer to filter the same amount of water with the CNOC bags than it did using the Evernew bags.
When I got home, I tried filtering clean water through the Squeeze using my Evernew bag, and was disappointed to see that the flow rate just wasn’t what I remembered it to be. While on the trail, I backflushed the filter 4 or 5 times using the included syringe, and I backflushed it again when I got home.
I also flushed a diluted amount of CLR through the filter prior to our trip. There’s a separate discussion about Sawyer and Katadyn BeFree flow rates, vinegar, CLR, and hardware scale deposits that can occur when sanitizing filters with bleach and hard water sources.
On a whim, I decided to back flush my Sawyer again, this time using the blue female-female coupler sold by Sawyer, and by connecting the filter directly the faucet of my utility sink to achieve higher pressure.
Back flushing at this higher pressure and volume appears to have made a marked improvement in performance. Far greater than my best attempts at back flushing the filter with the syringe.
Sadly, I did not measure before/after flow rates to quantify the change.
I would encourage others with a Sawyer filter and the blue female/female coupler to try back flushing by attaching the filter to your utility sink faucet. You may have to first unscrew the aerator from your faucet if your utility faucet has one.
P.S. The connection to the sawyer filter using the blue coupling connection wasn’t completely water tight. Some water still sprayed out at the connection. I just loosely wrapped my hand around the connection to prevent the leaking water from spraying up into the air and making a wet mess in my laundry area.
Regards
Jeff
Jeff go outside and use a hose and let it leak! I worry that the high pressure could have damaged the filter, thereby making flow faster by creating broken fibers and sideflows. Is there any particle out there that is colored and the same size as a bacteria to use to see if it gets thru the filter as a test?
From https://www.sawyerdirect.net/FAQWaterProducts
The fibers are very robust so please be FORCEFUL in your back flush process. When using the syringe do not be gentle, it will only form paths of least resistance instead blowing out the particulates that may be trapped in your filter. When using the faucet adapter, hold the adapter on the faucet and ‘turn the water up’ to ensure particle(s) removal.
From https://www.sawyerdirect.net/sp174
This Sawyer Faucet Adapter is for all Sawyer Water Filters and Purifiers. It connects the inline filter/purifier to most water taps. The adapter head is made of flexible PVC, which allows connecting to several different size faucet mounts. This faucet adapter is used for backwashing all Sawyer Filters and Purifiers, extending their life.
The SP174 adapter is now very difficult to find, so I figured the coupling adapter was equivalent.
I could suggest a slight improvement to the test apparatus to hold pressure (from gravity) constant as the bottle empties. Attaching the bottle to a longish spring (like a screen door spring) would raise the whole thing as the water flows out, but any improvement would be minor. You have a pretty solid testing apparatus.
I recently purchase a Sawyer Mini and conducted the same test. The time to filter 500 ml was 150 sec so the approximated filter area is 56.7/150 or ~38% of the filter area of the Sawyer Squeeze.
Saywer Squeeze ~ 3 oz (~$30)
Sawyer Mini ~2 oz (~$20)
The Sawyer Squeeze has about 3 times the filter area as a Mini and cost $10 more. IMO, that’s money well spent.
I recently updated my filter flow test, instead of using a scale I used a graduated cylinder to measure fluid volume. Additionally, I did some number crunching on the data and came up with some interesting results. By using a new Sawyer Squeeze filter as a baseline, you can use the effective area of the filter (new=ideal) to make comparisons between new and used filters. Additionally, when compared to a new Sawyer Mini filter, you can estimate potential performance. In my analysis, I had three real data point: a new Sawyer Squeeze, a new Sawyer Mini and a 5-year-old Sawyer Squeeze.
The Highlights are as follows;
Here is the testing video
Here is the number crunching video
Jon
the other thing about hollow tube filters like sawyer squeeze is don’t put bleach in it if you have hard water. That will clog up the filter. But you can use CLR/vinegar to clear it like Jeff said
maybe the model of a filter gradually clogging up applies more to conventional filters like PUR or MSR?
with a hollow tube filter like Sawyer Squeeze, if you backflush it clears most of the pores? It would be interesting to test a new filter, then test it occasionally for a few years. See if the flow rate gradually decreases.
maybe sawyer squeeze lifetime is determined by one bad incident, like freezing it.
does anyone have a Sawyer Squeeze they gave up on because it was too slow because it gradually clogged? even though they used optimum backflushing as mentioned above – connect to faucet, use warm water/CLR/vinegar?
I’ve used my Squeeze for 6 years and it works pretty much the same as new, although I haven’t measured it.
Regarding freezing, if you shake all the water out of it then there’ll just be water in the hollow tubes, but they’re designed to expand when you backflush so they should withstand freezing
Too bad there isn’t some solution that contains colored particles of some size greater than 0.1 micron. If they get through the filter you could see it.
Become a member to post in the forums.