Topic

Where to find current conditions for Wind River Range around 10,000ft?


Forum Posting

A Membership is required to post in the forums. Login or become a member to post in the member forums!

Home Forums Campfire Trip Planning Where to find current conditions for Wind River Range around 10,000ft?

Viewing 16 posts - 1 through 16 (of 16 total)
  • Author
    Posts
  • #3477052
    daved brosche
    BPL Member

    @travelgearblog-2

    I know about this site https://www.mountain-forecast.com but am unsure of where to look to get an accurate temperature around big sandy lake and surrounding area.

    I plan on going here at the end of August 2017.   Any weather or trail condition news would be appreciated.

    #3477057
    Skibbs
    Spectator

    @skibbs

    Locale: Conifer, CO

    I have always used NOAA’s site.  This link should put you in the general vicinity, just find where you need the forecast on the map and click it and it should update.

    http://forecast.weather.gov/MapClick.php?lat=42.7399&lon=-109.2049

    #3477079
    Brad Rogers
    BPL Member

    @mocs123

    Locale: Southeast Tennessee

    I use the same page Skibbs linked.

    #3477086
    Ben C
    BPL Member

    @alexdrewreed

    Locale: Kentucky

    If you are on caltopo, you can right click at any location and get that NOAA forecast for whatever location you right click.

    #3477087
    daved brosche
    BPL Member

    @travelgearblog-2

    Does that site/map account for the elevation too?

    #3477090
    Brad Rogers
    BPL Member

    @mocs123

    Locale: Southeast Tennessee

    The one Skibbs linked does.  I use it all over the country for backpacking and have had pretty good results with it.


    Ben – I didn’t know that about Caltopo, I will have to try it.  The more I play around with Cal Topo the cooler it is.

    #3477109
    Ben C
    BPL Member

    @alexdrewreed

    Locale: Kentucky

    You just right click, select point information, then NOAA forecast.  You’ll get the exact same forcast linked above that applies for the point where you clicked.  It’s very handy.


    #3479372
    obx hiker
    BPL Member

    @obxer

    That is indeed a good tip about Caltopo.

    When I want to get a feel for the typical patterns well as up to date info for a spot that actually has instruments rather than interpolated data I go to Noaa’s mesonet.

    http://www.wrh.noaa.gov/map/?&zoom=7&scroll_zoom=true&center=35.7688006602384,-80.70556640625&basemap=OpenStreetMap&boundaries=true,false,false&obs=true&obs_type=weather&elements=temp,wind,gust&obs_popup=true&obs_density=1

    One nice thing about mesonet is you can view the past 7 days weather per every 15 minutes or so and get a solid idea of the trends and even an idea of the typical wind directions with a frontal passage. It show temps, wind speed, direction and gusts, precip,  & barometric pressure. There’s a station near the trailhead and also a station near Elkhart. The forecasts use an algorithm to adjust the temperatures based on altitude.

    The station near big Sandy but it appears to be a few miles west of the trailhead at around 6000″. Looks like there was a big boomer on the 15th. 1.5″ rain in @ 90 minutes.

    The mesonet server or interface is apparently a little “janky” as is the map when you click on a site. Persevere! Noaa has a ton of info but it’s easy to get lost. There’s a page somewhere with snow cover but since, like you, I’m planning a visit the second half of August I haven’t yet ventured down that rabbit hole.

    #3480576
    obx hiker
    BPL Member

    @obxer

    Actually the station at Elkhart is at 9400 feet and doesn’t have a wind gauge. The one near Big Sandy is 9080 and has all basic instruments.  Current lows are ranging from the lower 50’s at Elkhart and mid 40’s at Big Sandy. Highs in mid to upper 70’s both location. Lately some rain almost every afternoon carrying into the evening and occasionally again in the am, sometimes at night. Subtract the usual 4-5 degrees for 1000 feet.  Temperature peaks every day @ 2-3pm and bottoms every day @ 5-6 am. Wind and gusts peak follows the temp peak by @ 3 hours so @ 5. Dies out almost completely around 9 pm. Pretty much the same pattern with the showers. The chart is so regular it looks like a cardiogram. Biggest anomaly is those wee morning showers but that probably follows with the coolest temps.

    Of course there have not apparently been any big frontal passages, and this seems to be the current July calm weather pattern. Likely to change for August etc.

    #3480578
    obx hiker
    BPL Member

    @obxer

    There’s this too:  http://www.greatoutdoorshop.com/trailhead-conditions-report-7122017/

    Seems to generally be updated weekly.

    Apparently the Winds had a big snow year or are having a late thaw.  From the current 7/12 report: “The current snow line is hovering between 10,500 ft. and 10,800 ft., depending on aspect. Above these elevations, the snowpack is coming in at a little over 200% of average. ”

    With current temps must be a lot of flowing water soon to be followed by lots of moskies!

    #3481144
    obx hiker
    BPL Member

    @obxer

    I just love talking to myself……. ;)   but anyway………  Since I’m going on my own trip @ mid- August I am curious and have figured out a couple other things I’ll share; which BTW are applicable pretty much anywhere there’s a weather data collecting station.

    Since the interior of the Winds is pretty much a blank slate as far as data points; the only station above 10,000 feet is Hall’s Park: I decided to look west and found some stations above 10,000 in that direction. There’s one about the same latitude as Elkhart about 45 miles west on Deadman’s Peak labelled DEABT at 10350. There’s also one in the Tetons west of Disappointment Peak on the north shoulder of Middle Teton labelled  TETWY at 11610! The low temps at both these stations have been running basically 50+ for several days.

    The Great Outdoor Shop hasn’t updated it’s trail report since 7/12 where they listed the snowline at @ as above but with these low temps its bound to be moving right up.

    #3482112
    daved brosche
    BPL Member

    @travelgearblog-2

    @obxcola Sorry for the late reply.  Busy summer.

    Thanks for all this.  It helped a good bit.  I looked up Big Sandy on NOWA but its still only showing it at around 7,000 ft.

    http://forecast.weather.gov/MapClick.php?lat=42.6314&lon=-109.4629#.WX9w0riGORs

    Same when I looked up elkhart.

    Where/how are you finding the ones at 10,000 ft?

    #3482139
    Ben C
    BPL Member

    @alexdrewreed

    Locale: Kentucky

    You can get a big difference in conditions there with elevation.  We went last year over Labor day.  We were camping in Alpine Lakes at decent elevation.  A blizzard blew through.  There is very little in the way of wind protection.  We held onto our tent all night through wind and snow.  We made it to lower elevations the next day and there was no snow.  Really, just a few hundred feet made a world of difference.

    #3482239
    Greg Mihalik
    Spectator

    @greg23

    Locale: Colorado

    Daved –

    These are the Current Conditions at the weather station closest to where you click on the Point Forecast Map –

    …. or you’ll get the station at Lander, also a low elevation.


    This is the Detailed Forecast for the location you clicked on (your link) 7,398′ –

    If you want a higher elevation, Zoom In, then click on a 10,000′ contour close to your point of interest.


    #3482572
    obx hiker
    BPL Member

    @obxer

    You have to get on the NOAA mesonet page and patiently zoom in on the Winds: Very long link below. The sites tend to ring the range and evidently require some sort of approximate vehicular access. The highest elev. is Hobbs Park on the reservation side. There’s a pop-up box for each site which shows the elevation. Most of the reporting stations are Snotel sites. This map manipulates a LARGE amount of data and you must be patient and persistent to get used to pulling out the data. It can be balky loading data for individual sites . I click on one and walk off and do something else for awhile. And we have fairly fast speeds so while say fiber optic might be faster (and our main transmission is fiber) I think the lag is response from the data server; but hey I’m NOT a tech guy!

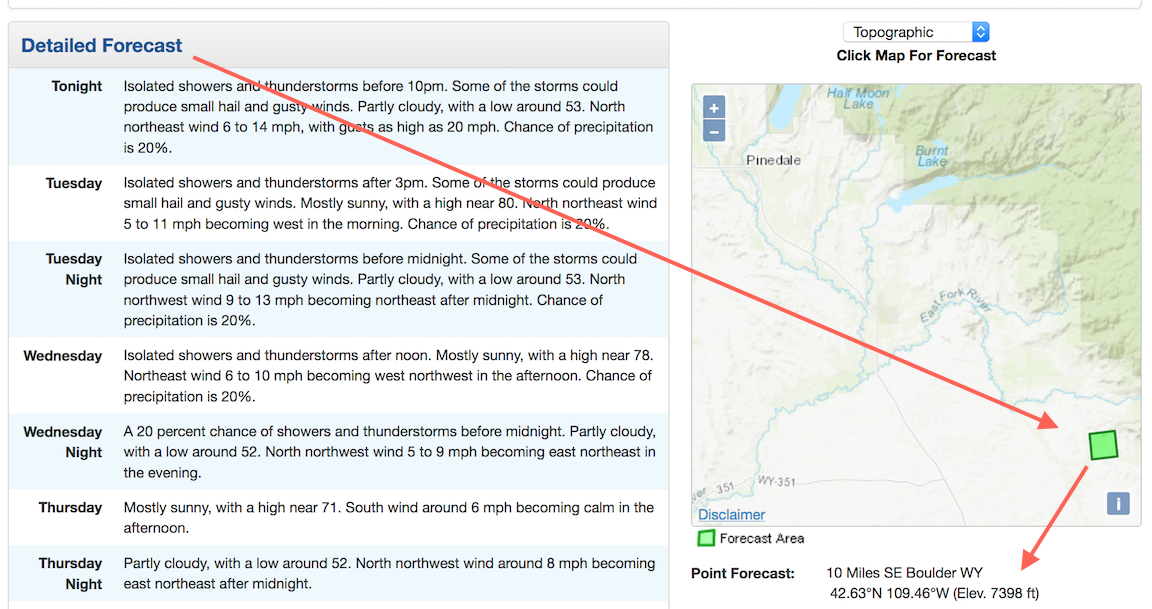
    Referencing Greg’s post above; my impression is that the NWS uses the data from the relevant reporting stations to make their forecasts. So there is a transposition of real data to predict conditions at a nearby, but different; random position. Obviously this makes the NWS spot forecast in some respects a guess; all be it a pretty educated guess. I like looking at the actual site data to see what is really going on and to get familiar with daily patterns. How cold is the typical low temp, when does it occur? etc. From what I’m seeing there’s also a really regular pattern to daily rain showers and afternoon storms which bears out all the cautions in Pallister’s book.

    Greg posted a nice screenshot showing where you had clicked.  You can zoom in on that map and re-click. If you zoom in and follow the Big Sandy trailhead road I think the snotel site is on a little forest service road 10301 or 10302 near the trailhead. You can click anywhere on that map and get an interpolated forecast which is in part related to the actual observations for the weather data stations shown on the mesonet map.

    BTW: the Great Outdoor Shop in Pinedale posted a new ( as of the 29th) trail report.

    http://www.greatoutdoorshop.com/trailhead-conditions-report-7292017/

    Here’s a link to some VERY recent photos that, based on what I can tell of the locations, were taken up to @11000 foot level and show higher elevations. For example you can see the ramps leading up onto Angel Pass on the west side and they look partly snowy, partly clear.

    http://www.pinedaleonline.com/photogallery/davebell/SecondAnnualWindRive/home.htm

    Mesonet link below: It will come up showing your location and you have to pan to the Winds and wait for the stations to come up, then click on the stations and wait for the data to come up, which is the tedious part. The default is 2 days data but the menu bar allows for bringing up 7, which actually occurs rapidly once you get the original 2 days and are, i guess, sorta locked in to that station in the database.

    http://www.wrh.noaa.gov/map/?&zoom=7&scroll_zoom=true&center=35.7688006602384,-80.70556640625&basemap=OpenStreetMap&boundaries=true,false,false&obs=true&obs_type=weather&elements=temp,wind,gust&obs_popup=true&obs_density=1

    And Finally: For some reason Big Sandy Lake doesn’t show on the NWS base map. Your guess is good as mine why not. You can still figure that area out easily. I guess maybe it’s shallow? Valentine shows for example, Lonesome Lake in the Cirque doesn’t as well. Maybe they’re sorta seasonal? Go figure. Lots of these maps are computer generated from satellite photos so there can easily be some misinterpretation.

    And finally, finally. These sites are not manned. Often battery or solar powered; and sometimes they go down; and stay down for days and even weeks. Your tax dollars diverted to tax breaks. So again be prepared to work around with similar sites at similar locations etc. Here on the Sandbar we lose buoys and even land based sites constantly. Probably pretty similar to the problems keeping these things working and communicating in the mountains.

    #3483000
    daved brosche
    BPL Member

    @travelgearblog-2

Viewing 16 posts - 1 through 16 (of 16 total)
  • You must be logged in to reply to this topic.
Forum Posting

A Membership is required to post in the forums. Login or become a member to post in the member forums!

Get the Newsletter

Get our free Handbook and Receive our weekly newsletter to see what's new at Backpacking Light!

Gear Research & Discovery Tools


Loading...