I understand that different tools have different sampling intervals and so the data can come out looking different. But I’m finding the weirdness goes beyond that explanation in a recent example. I’m hoping someone might be able to explain it. It doesn’t really matter that much in the case of this particular trip, but I’m wondering if this happens more frequently and I just don’t realize it?
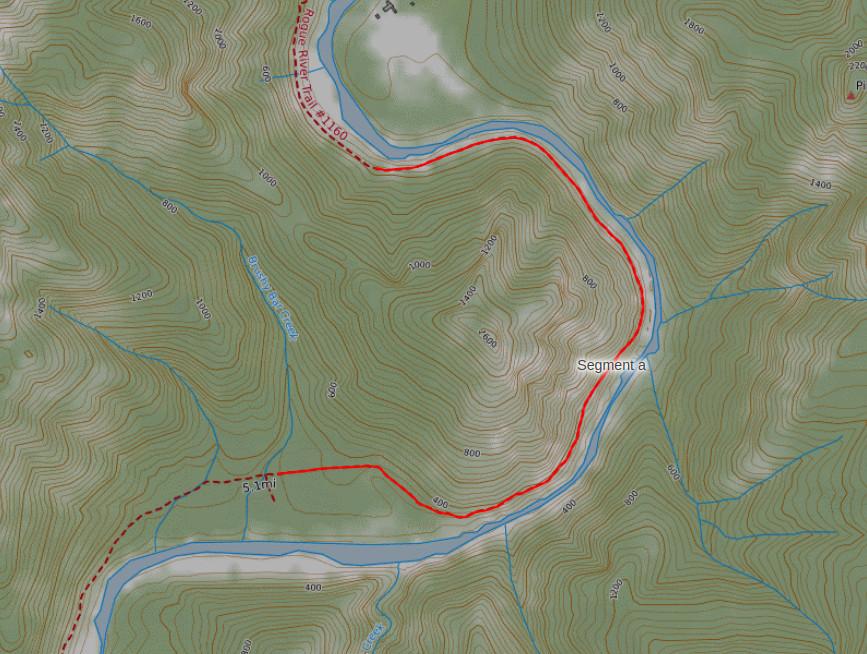
I was planning to hike a version of the Wild Rogue Loop and during trip planning was plotting out the route on CalTopo and Gaia. In the planning phase, they were telling me there was something like 10,000′ elev gain, which was obviously not correct (the route follows the river for a ways, then climbs up to and along a ridgeline that tops out around 3700′, then back to the river).
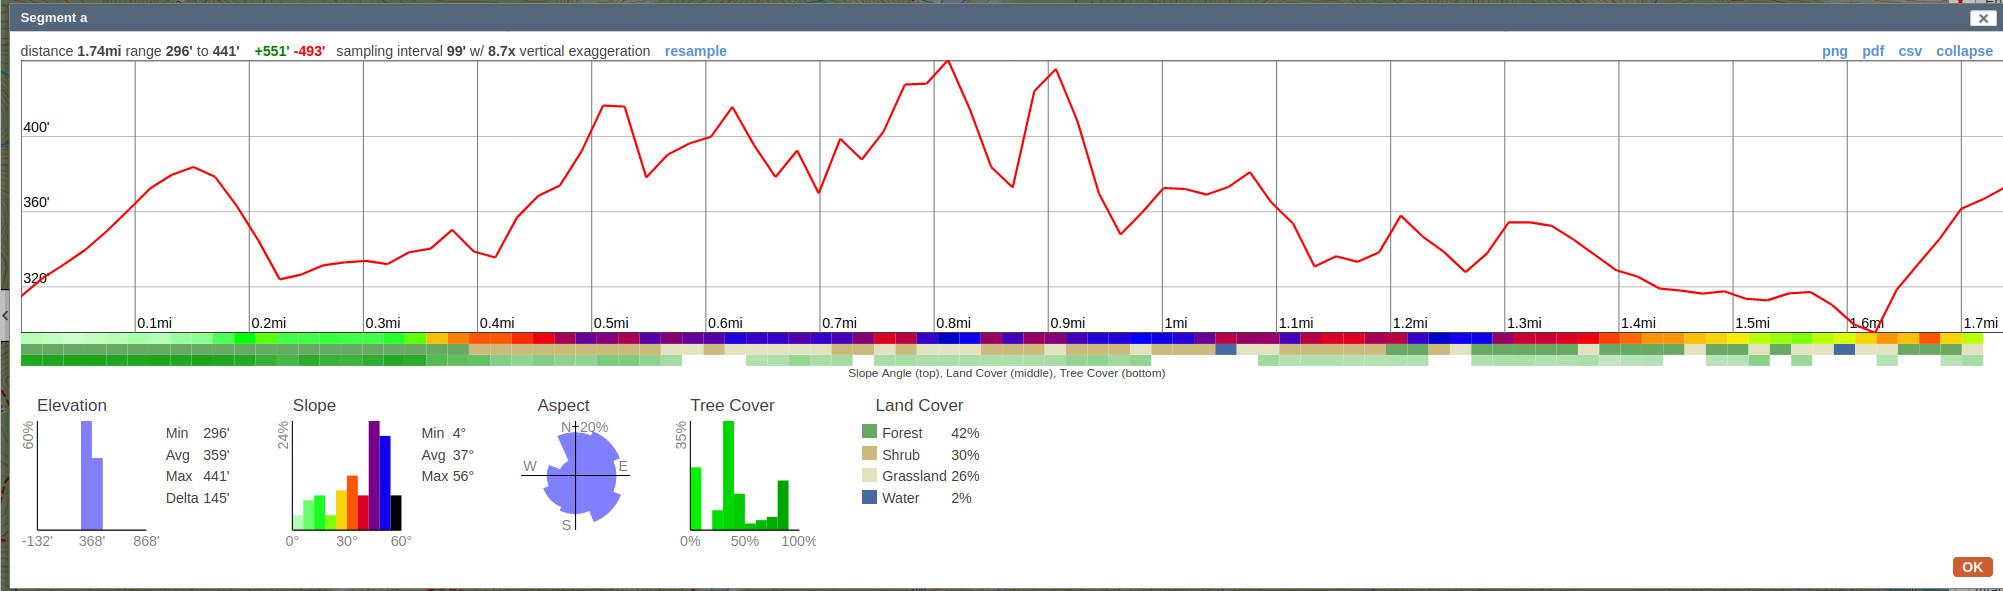
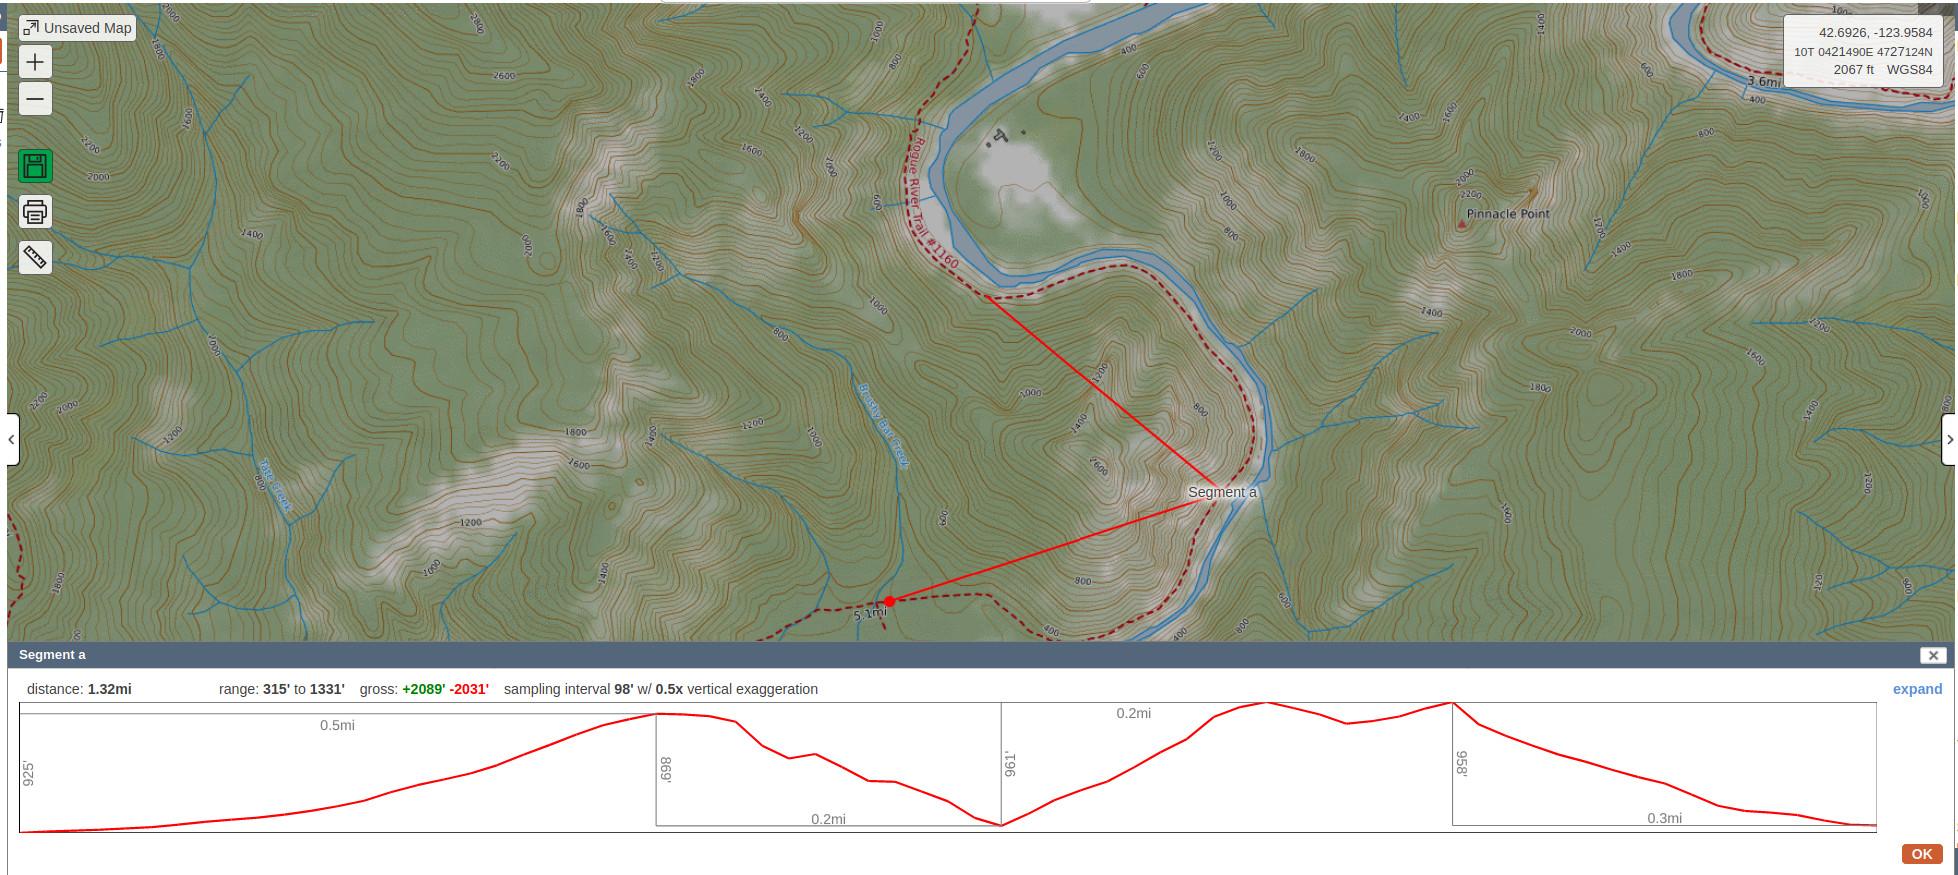
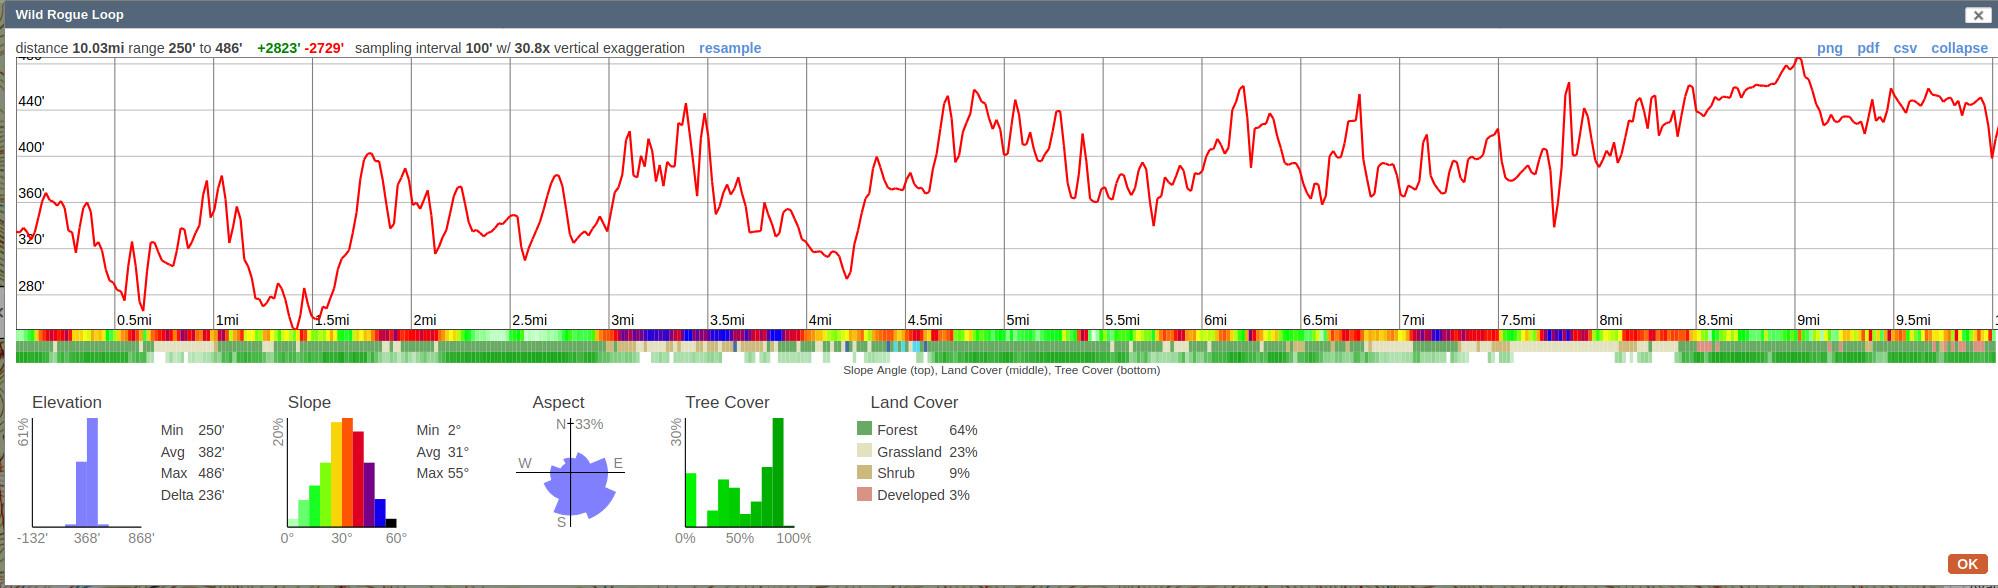
To settle the mystery, I tracked my actual route using Gaia. Now looking at the track on the computer, CalTopo is saying I climbed over 14,000′ and Gaia claims I did just under 8,000′. I’d love to believe I did either of those, but I doubt I got even Gaia’s reported gain on this short trip; while it was a rolling route it’s hard to believe 8,000′ gain would even be possible. Gaia is also showing I did 3 miles less than CalTopo shows.
In comparing previous routes between Gaia and CalTopo, I usually find the mileage is pretty close and that Gaia underreports elev gain, particularly in rolling terrain. But in this case, the differences are pretty big, Gaia is showing far less gain, and neither elev gain seems close to accurate.
Any idea what’s going on here? Thanks!