Doug wrote,
I’ve read that as satellites continue to proliferate in our skies, astronomy is really taking a hit. Have you (Nick and Paul) noticed this in your sky watching?
Paul said,
I’m primariy a visual observer, so the satellites don’t both me so much. But for those like Nick, and professional astronomers, they are more serious–the track fo a satellite across an astrophotograph is a bit like a big nasty scratch across an olf vinyl record. Not good.
As Paul mentioned, for visual observers with a telescope, they aren’t an issue unless they are a bunch of StarLinks just dumped by Elon.
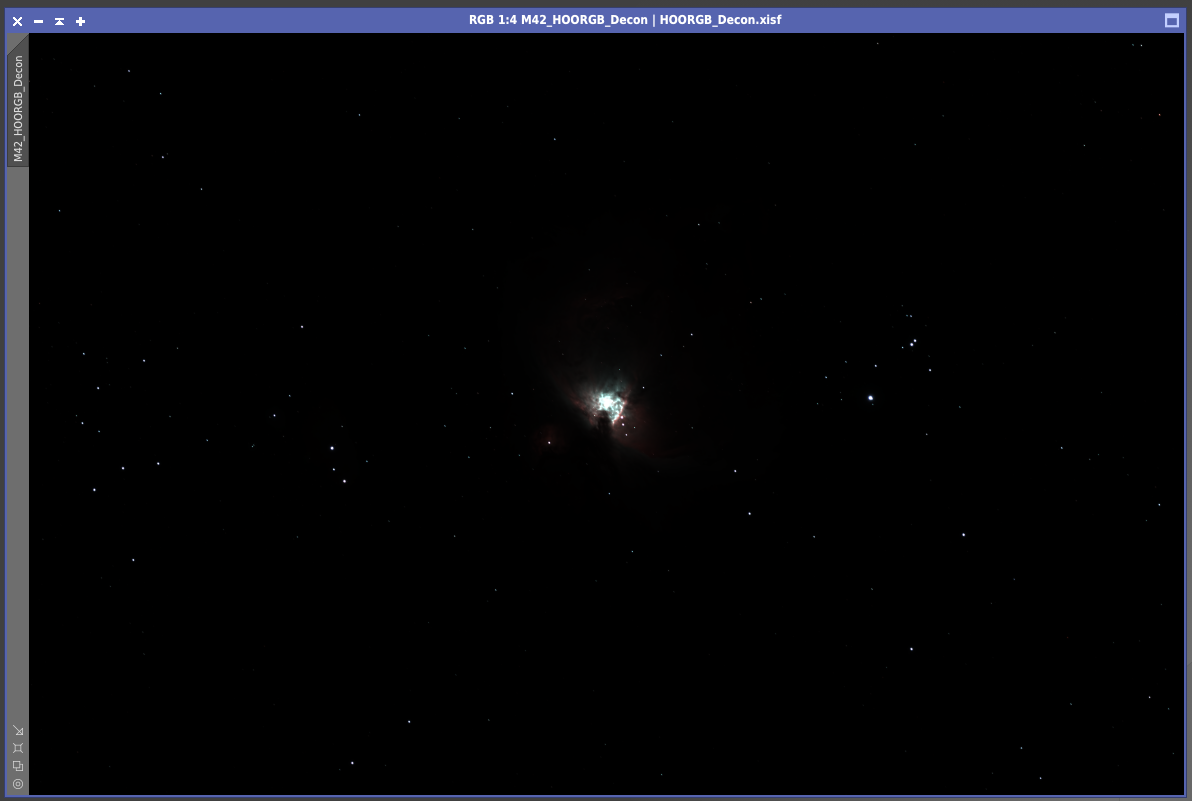
Below is a master image that stacked about 23 hours of images (over 1,000 frames). The satellite tracks have been removed, but one wouldn’t see them anyway because the image is linear — it is kinda like what one would see visually with a telescope. This is the Orion Nebula, an area that has a large population of geosynchronous satellites crossing in winter.

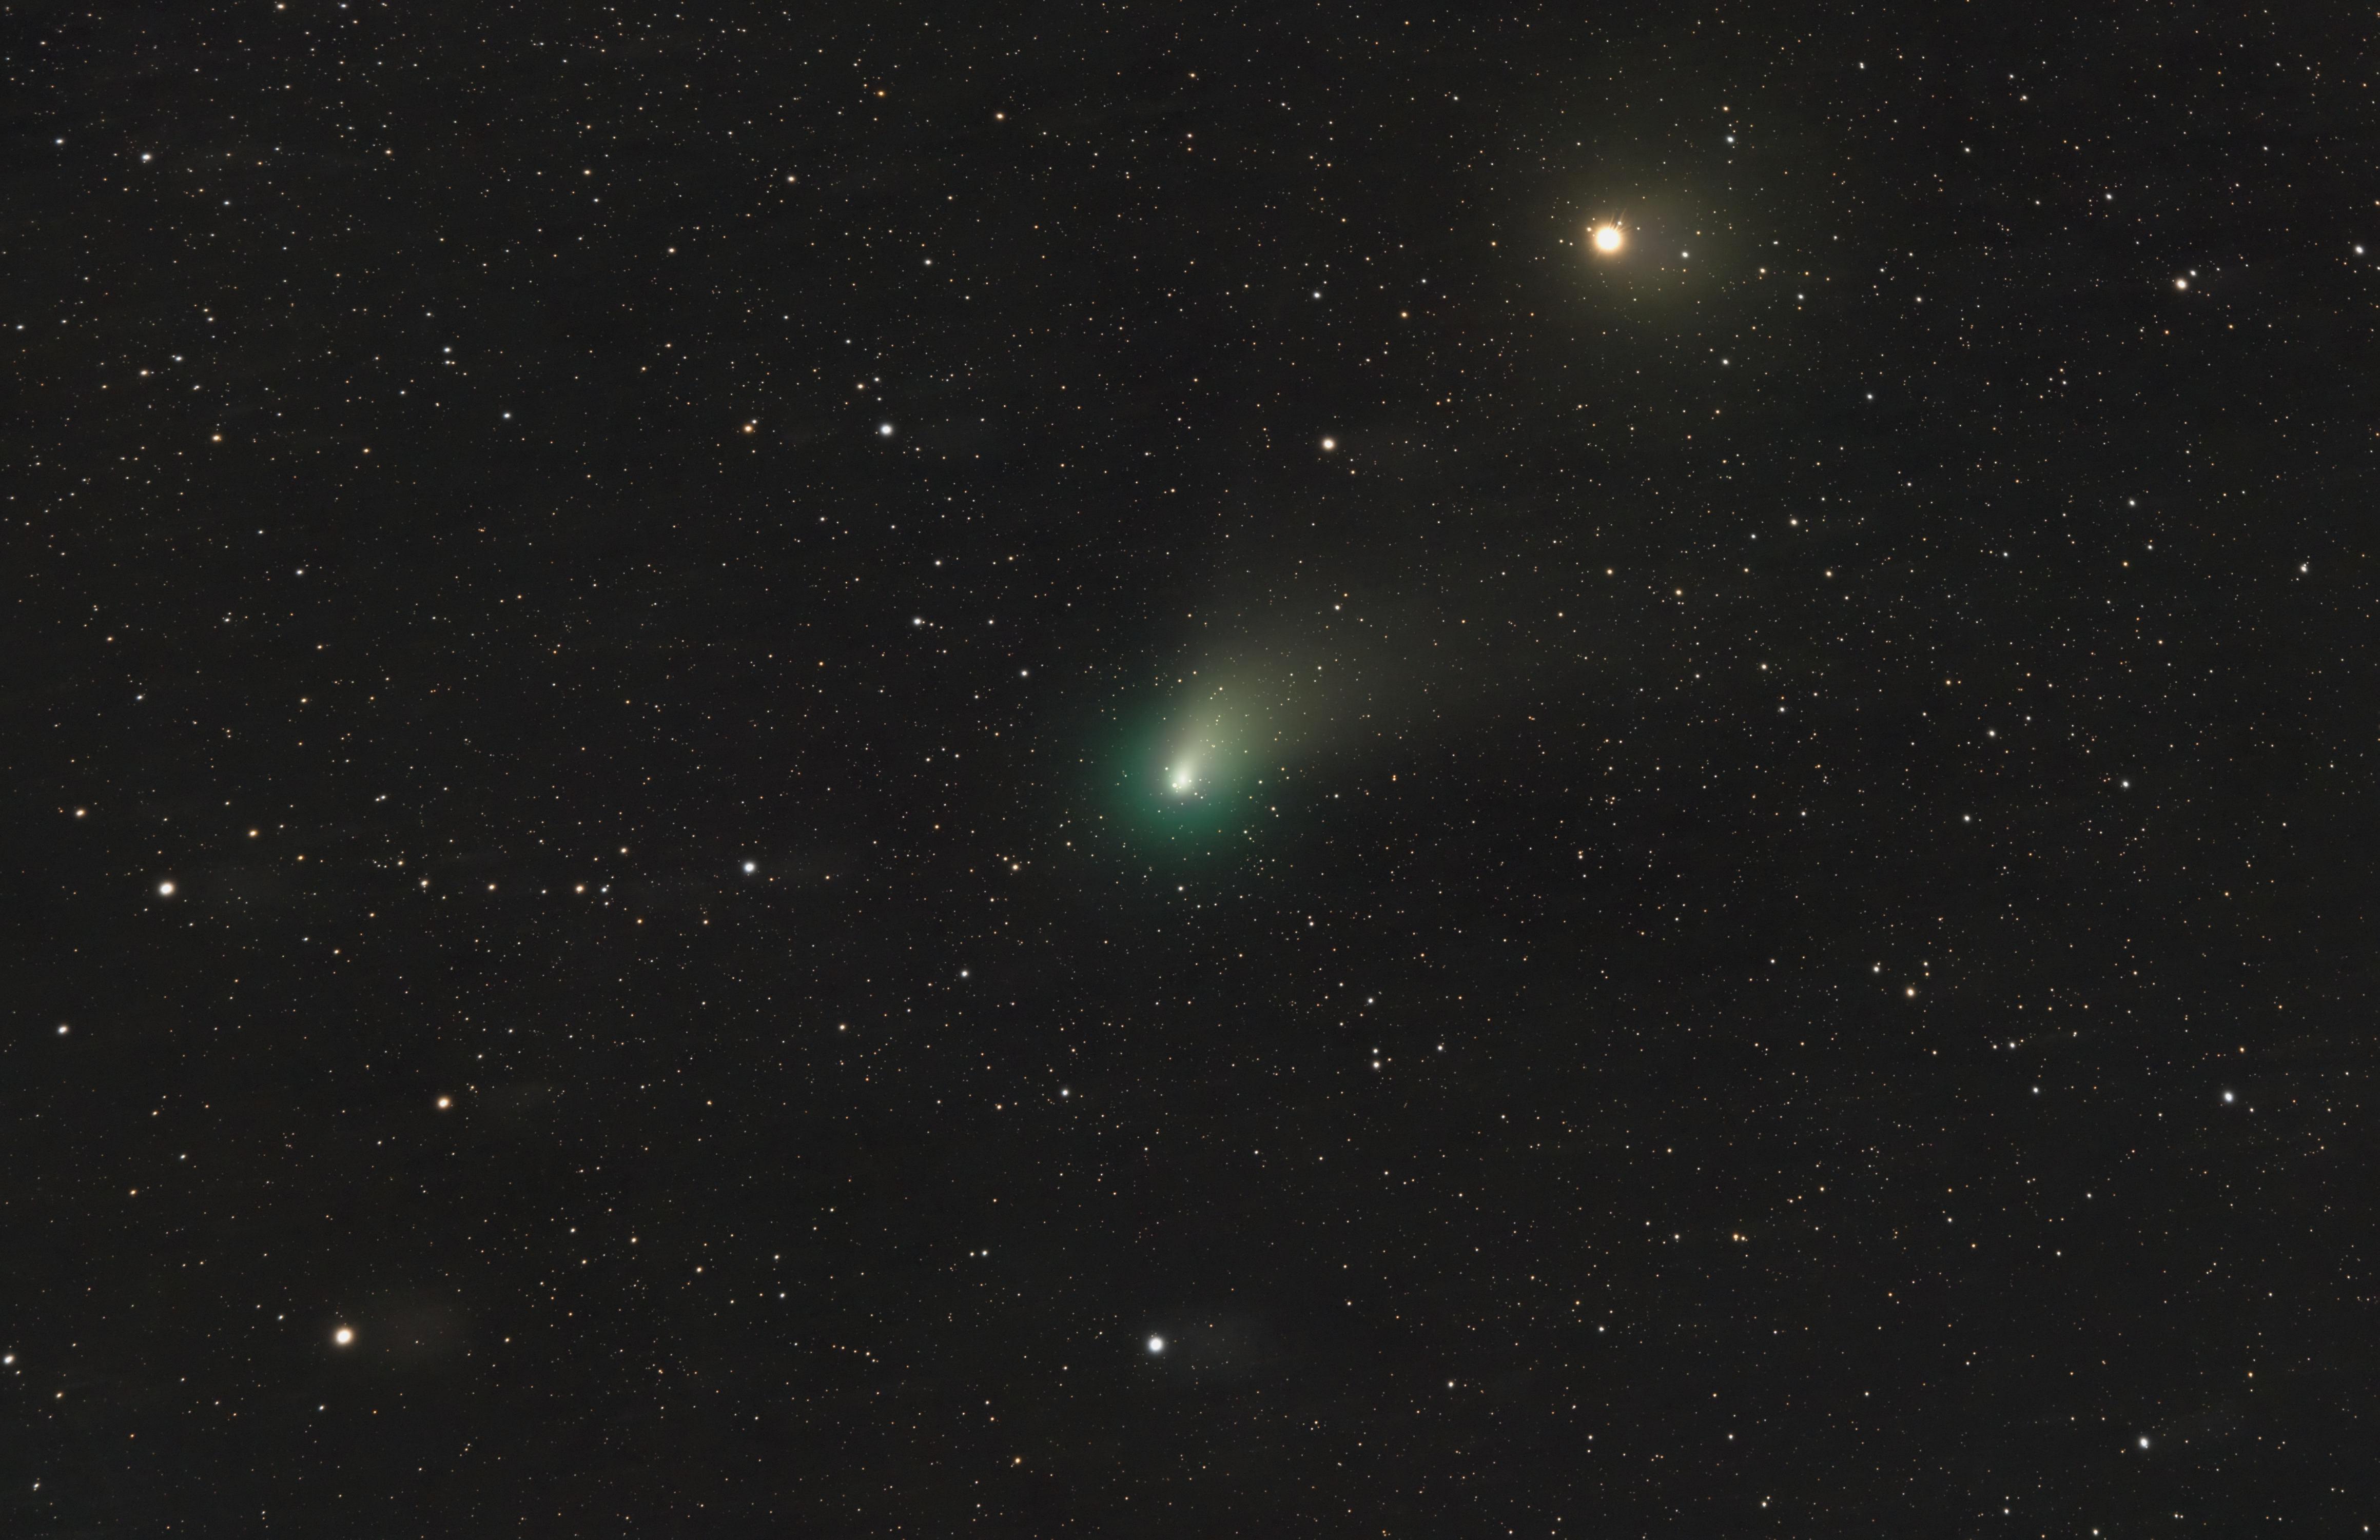
Below is an image by Amir H. Abolfath, which was the NASA Astrophotography Picture of the Day for 1 Jun 2021. The image has been fully processed into a non-linear photograph, but the satellite trails were purposely left in. The final image is 207 minutes of total exposure time (69 images of 3 minutes each).
You can imagine how many tracks I had in my 23 hours of images (1,380 minutes total, or over 6.6 times as much total exposure time as Amir’s). One of the reasons we take many images is because you can’t do much with a single image that has a bunch of airplanes, satellites, wind, etc. messing things up.
Sixty, one-minute exposures stacked will give you the same signal to noise ratio and data as a single 1-hour exposure. With 60, one-minute exposures, you won’t loose much data if you have to throw a couple away.
Jerry mentioned,
although, if they take a bunch of short exposures and then combine them, which is what they do anyway, they can just throw out the satellite tracks
Not in the Orion Constellation — you would have to discard too many frames — and it is wasted time too!
There is a better way.
When we stack many images, we are doing more than just stacking, which we called “Integration.”
Integration
A high level explanation of the Orion Nebula picture I took a couple years ago: I stacked over 1,000 images, each with 16.2 million pixels. The following explanation doesn’t cover everything that is done during this “integration.”
The software analyzed the stars in each individual picture and identified the same brightest 500 stars in each, and then stacked all of them using the center of each matching star to perfectly align each image with all the others — thus every single pixel is aligned to the same pixel location on each image.
It gets even more difficult, I purposely did not have the scope pointed to the same exact spot. After each image was taken, I purposely had the mount randomly move a few pixels, so no patterns developed due to any bad pixels in the camera sensor (every camera has numerous bad pixels)
So. . .
16.2 Million pixels X 1,000 images = 16.2 billion pixels the software has to keep track of! Not only does it use a lot of processing power, but it used 250GB of temporary disc swap file storage space.
Using an algorithm/method the software determines values for each pixel with mean values, standard deviations and other statistical stuff that would explode my brain — the end result is it rejects outlier pixels, which can be satellite trails, airplane trails, or something else. So instead of 1,000 almost exact pixels for each singe pixel location, we might end up with 998 pixels for some locations and 1,000 in other locations. The statistically bad pixels are rejected.
This process took several hours for the computer to do.
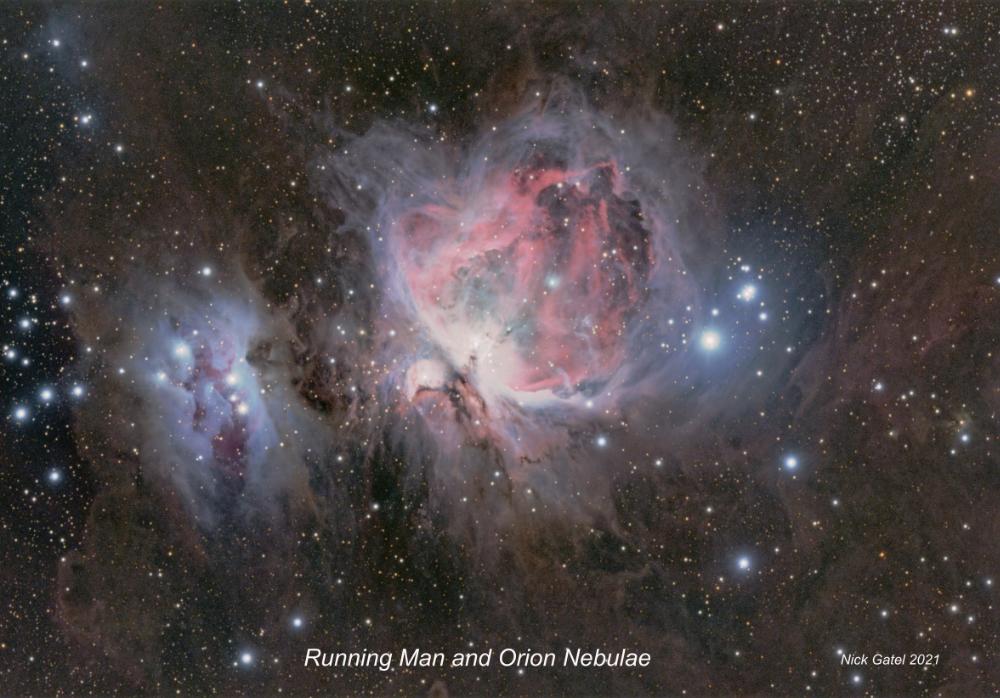
The final integration file, which I posted earlier, was a single linear 338MB file. Linear meaning the values of each pixel remains as the camera recorded it. I then used post-processing software to change it to nonlinear, which is what us humans can see and might be described as “stretching the color tones.” Below is a nonlinear version.
For those interested or who love math and calculus, here’s a link to reference documentation for the primary software I use and this is just the Image Integration Documentation. Once you open it, use your “search” function to find “Sigma Clipping” and “Winsorized Sigma Clipping” in the reference guide. I use “Winsorized Sigma Clipping” on all my image integrations, which is what “removes” satellite trails.