MYOG: Sleeping better while produce better Air Permeability data without a bigger vacuum cleaner
I know you have all experienced this: It’s 3 AM, and every time I almost fall asleep, I have this dream. I can’t get my Air Permeability tester to blow enough air through a 2.75” hole to measure the air permeability of a Brynje fishnet! This dream occurred because I had, just that day, discovered a vacuum cleaner that was even bigger than the one I was presently using. This type was made to be wall-mounted.
A little research revealed that the wall-mounted vacuum was actually no more powerful than the monster shop vac I was presently using. You all understand my disappointment.
The next morning, I had a nice conversation with my good friend, the ChatGPT Chatbot, about how to achieve the right amount of pressure and flow from my present vacuum cleaner to test a fabric like a Brynje fishnet.
That conversation led to the development of version four of my air permeability tester.
These were my project objectives:
· The new device would replace my version three tester.
· It would measure from 1 CFM/FT2 to 2000 CFM/Ft2.
· It would cost no more than $500 to build.
· It would use my present vacuum.
The concept of an air permeability tester is pretty simple. By blowing a sufficient volume of air on one side of a test fabric that covers a 2.75” discharge orifice, you establish a pressure across the fabric of .5” wc (Water Column). You then measure the volume of air passing through the fabric per minute in cubic feet per minute (CFM) and divide that by the area of the discharge orifice (0.04125 square feet) to obtain Air Permeability in CFM/Ft2.
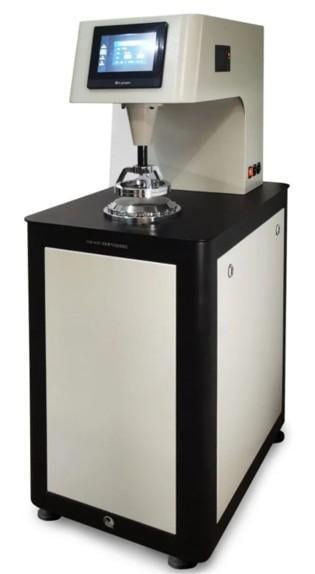
The easiest way to do this is to purchase a commercial instrument for $15,000 to $25,000, such as the one shown below.
The harder, but cheaper way is to build a do-it-yourself version.
Here is my version two tester.
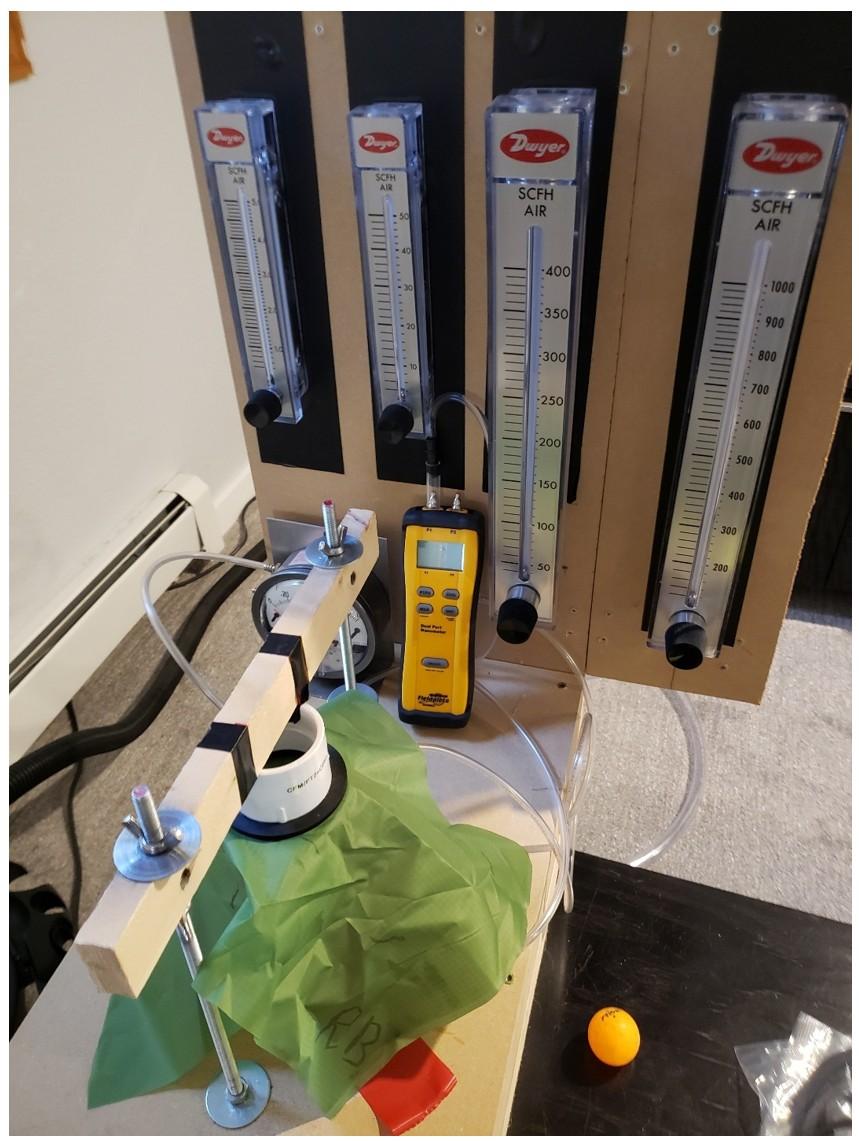
Air from the vacuum cleaner blows through the bottom of one or more of the variable orifice flow meters. This measures the air flow through the test apparatus and out of the discharge duct. Clamping pressure to hold the test fabric tightly in the airflow stream with no leaks is provided by a 1” by 2” wood piece secured to two all-thread screws. I adapted the clamping method from a MYOG article in Backpackinglight back in 2019.
This version was designed to measure a 300 CFM/Ft2 air permeability, which it did successfully.
In version three, I added a much taller and wider test discharge tube. This produced reduced air turbulence through the discharge tube. I also created some reduced-orifice discharge plates that I could install beneath the test fabric. These plates enabled me to measure air permeability up to approximately 1000 CFM/Ft². These plates introduced a minor error compared to test results derived from a 2.75” discharge orifice. Standard ASTM D 737 permits various discharge orifice sizes but does not provide a method for reconciling changes in test numbers resulting from the use of alternative orifice sizes.
How the New System Works
Here is the new, tester version 4, in four views.
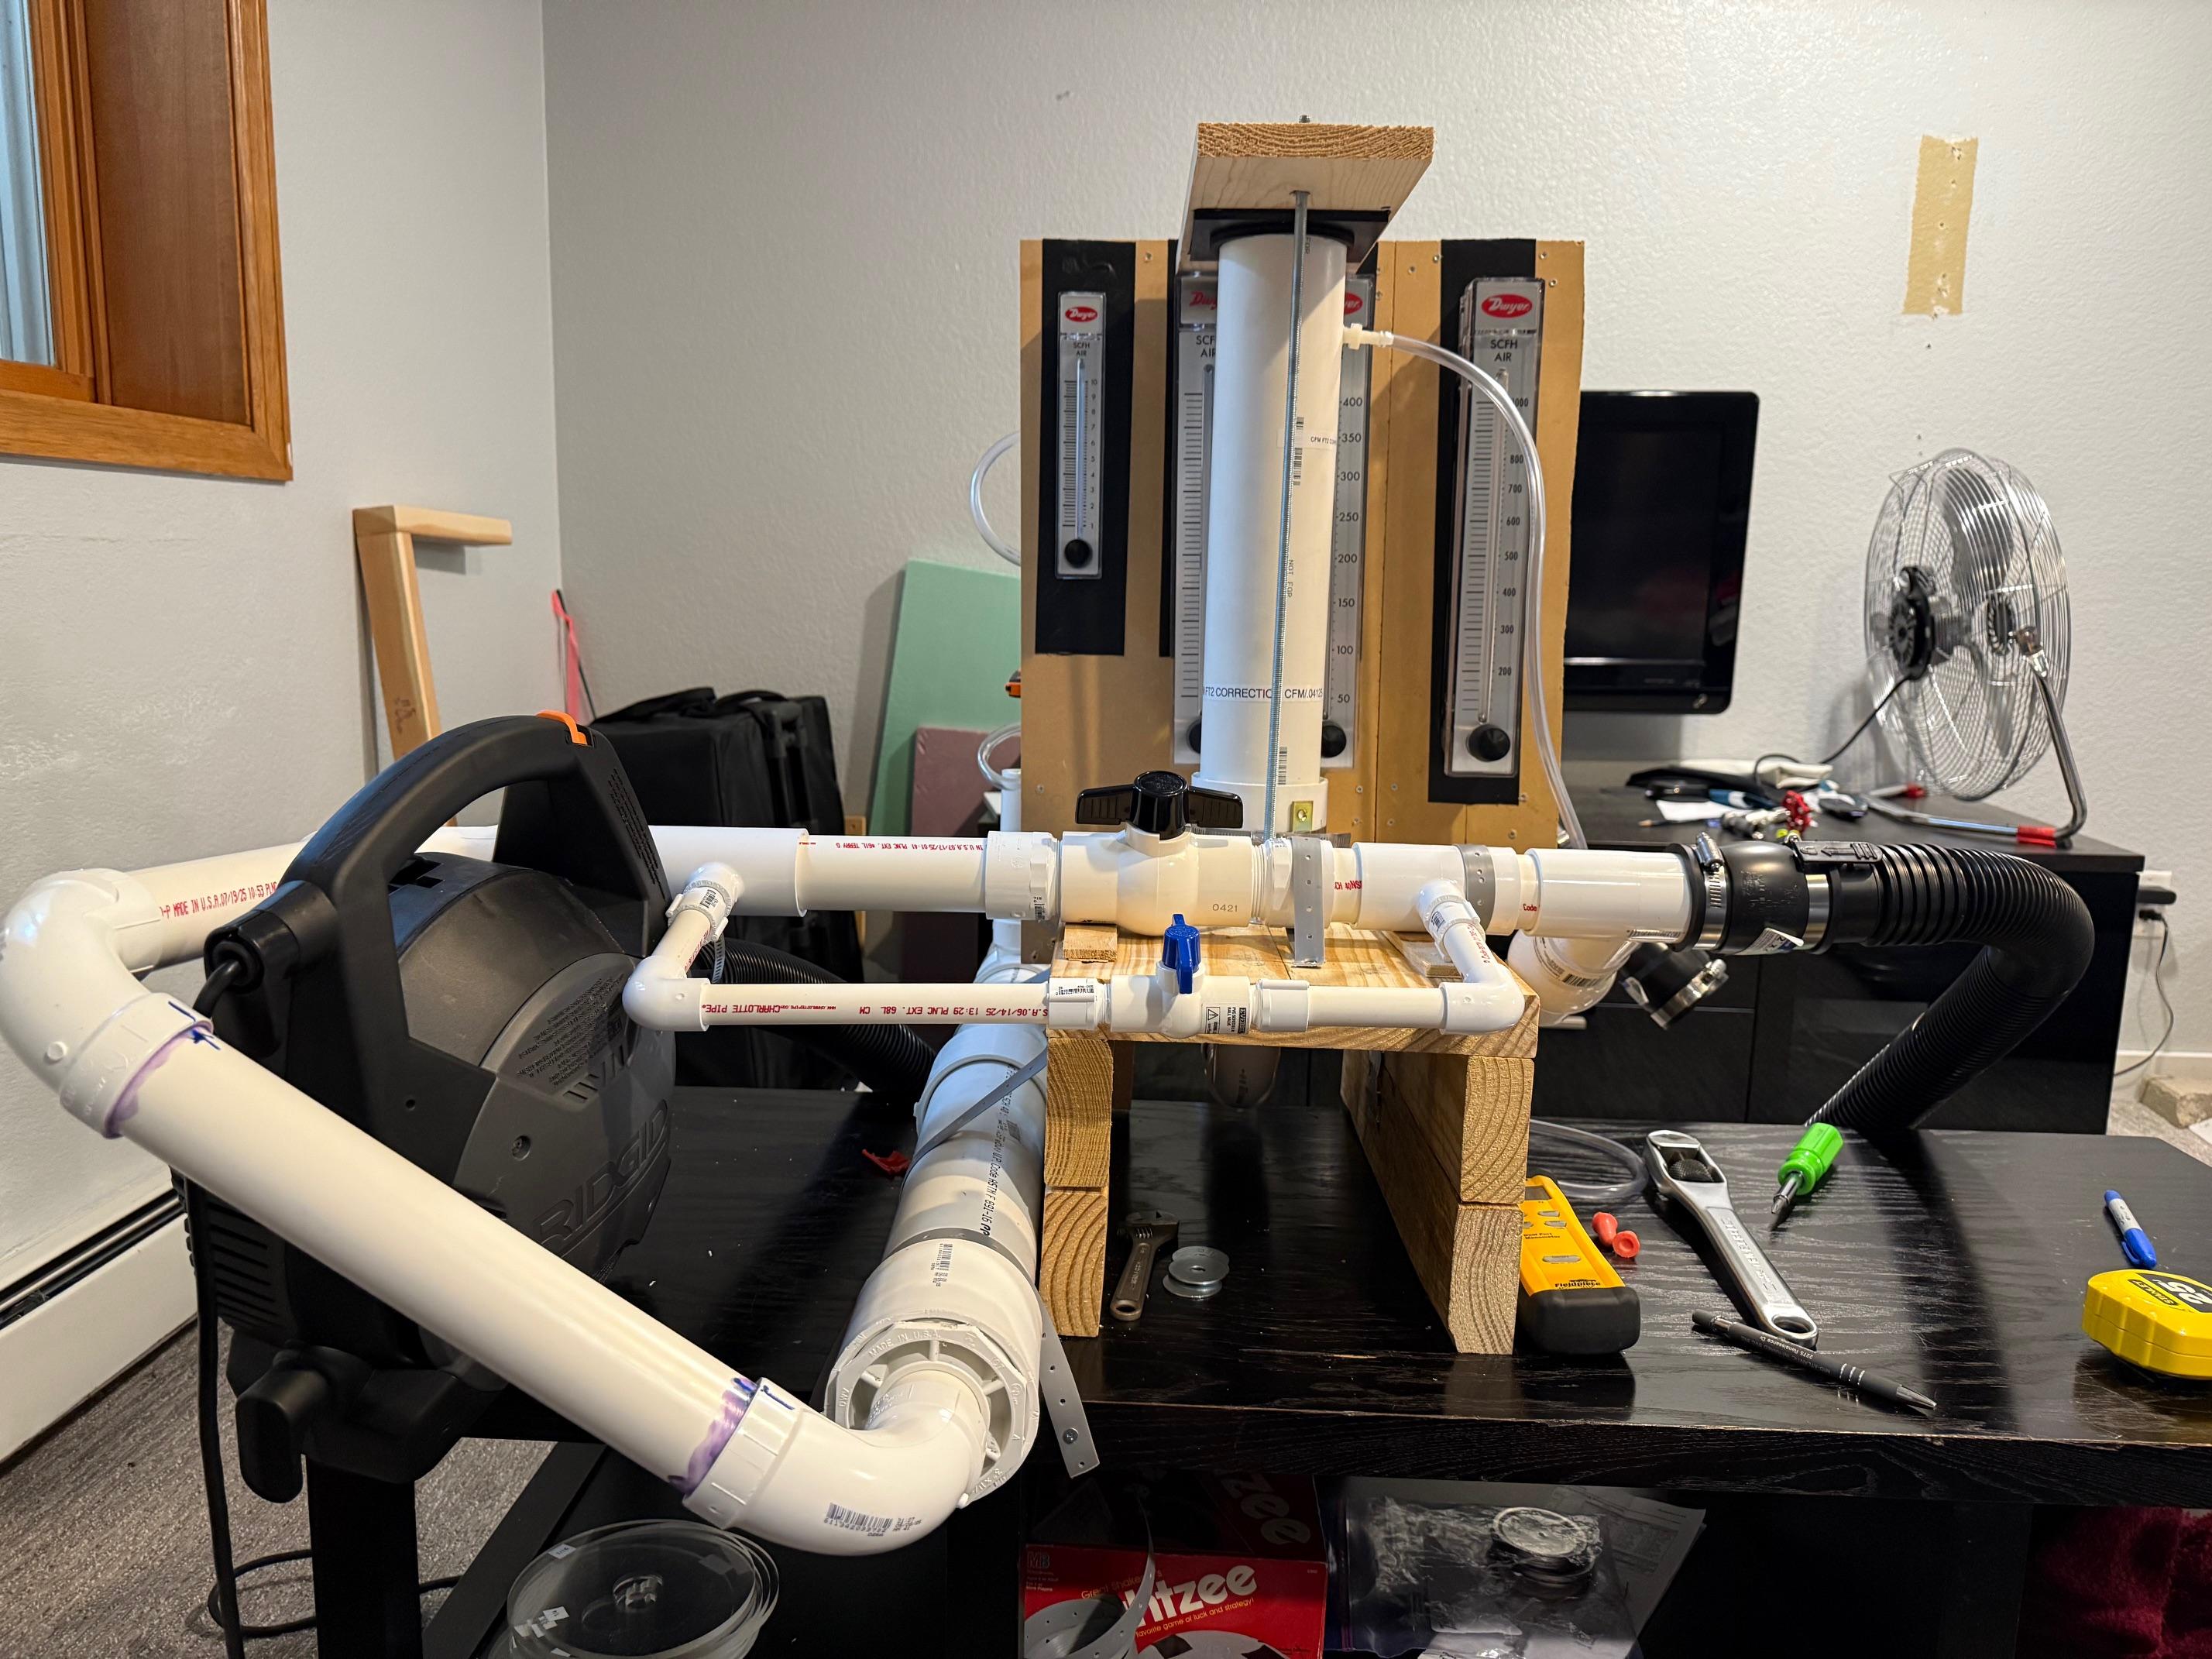
Front view.
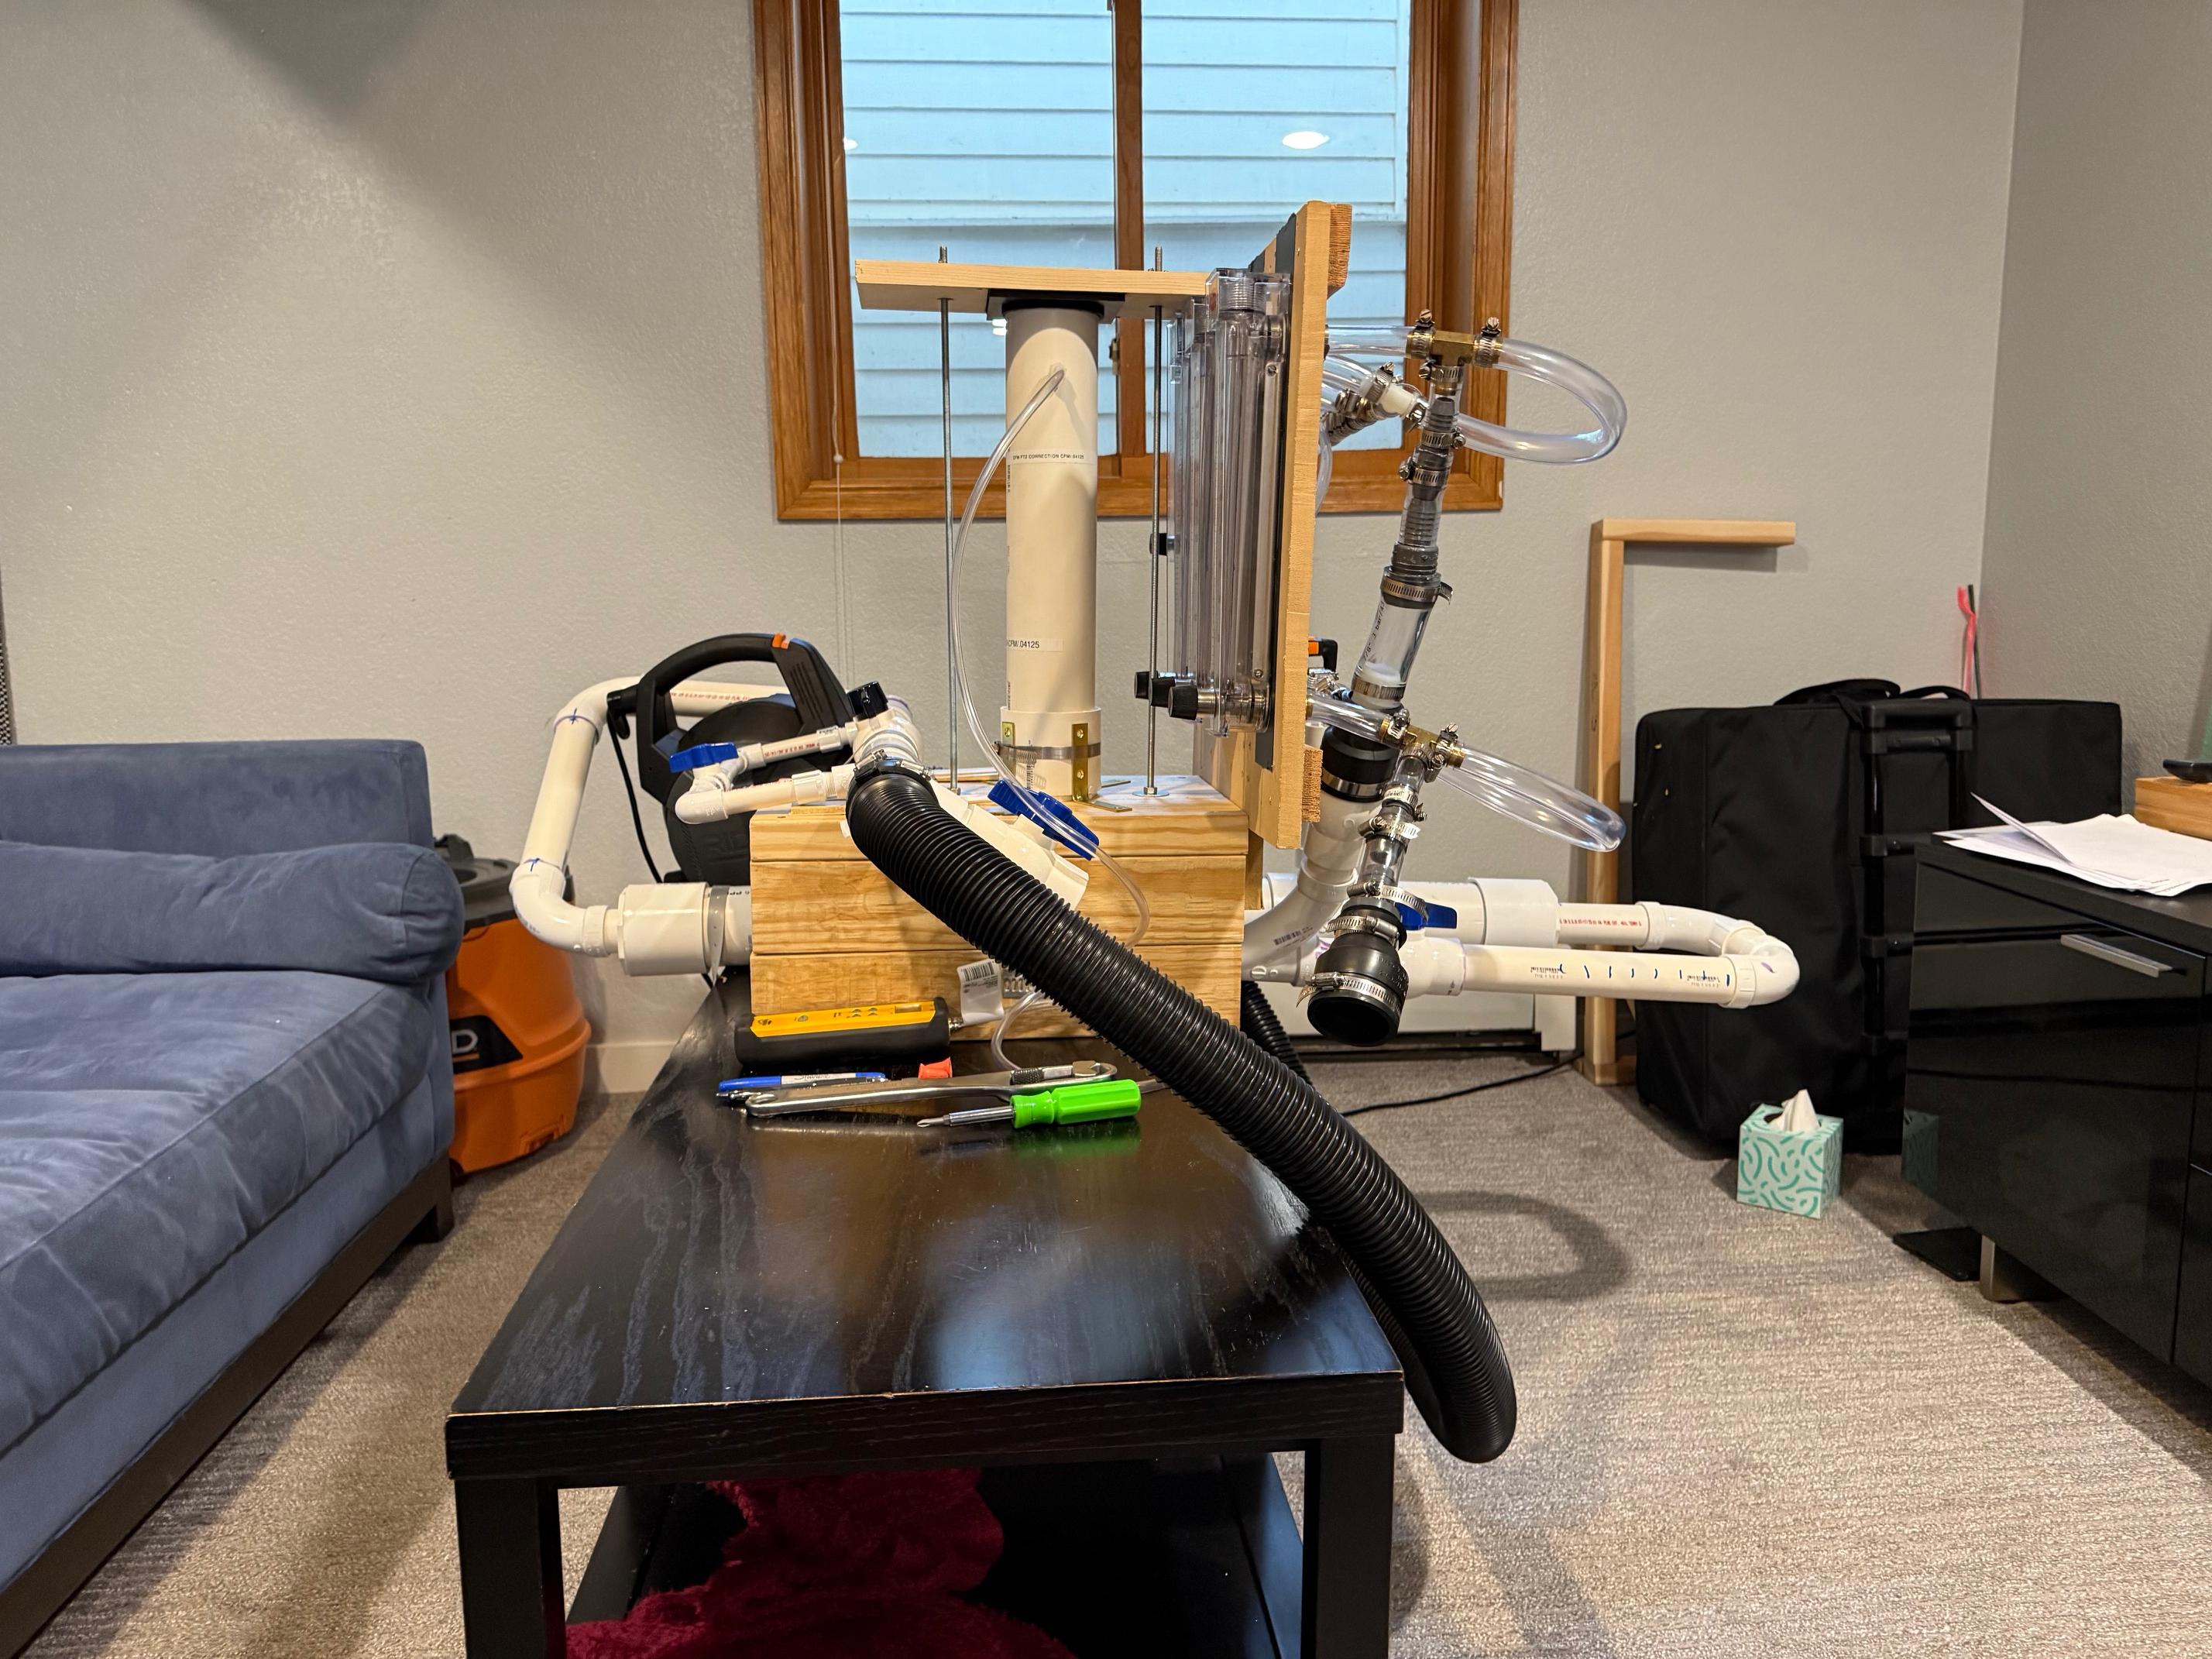
Right side view
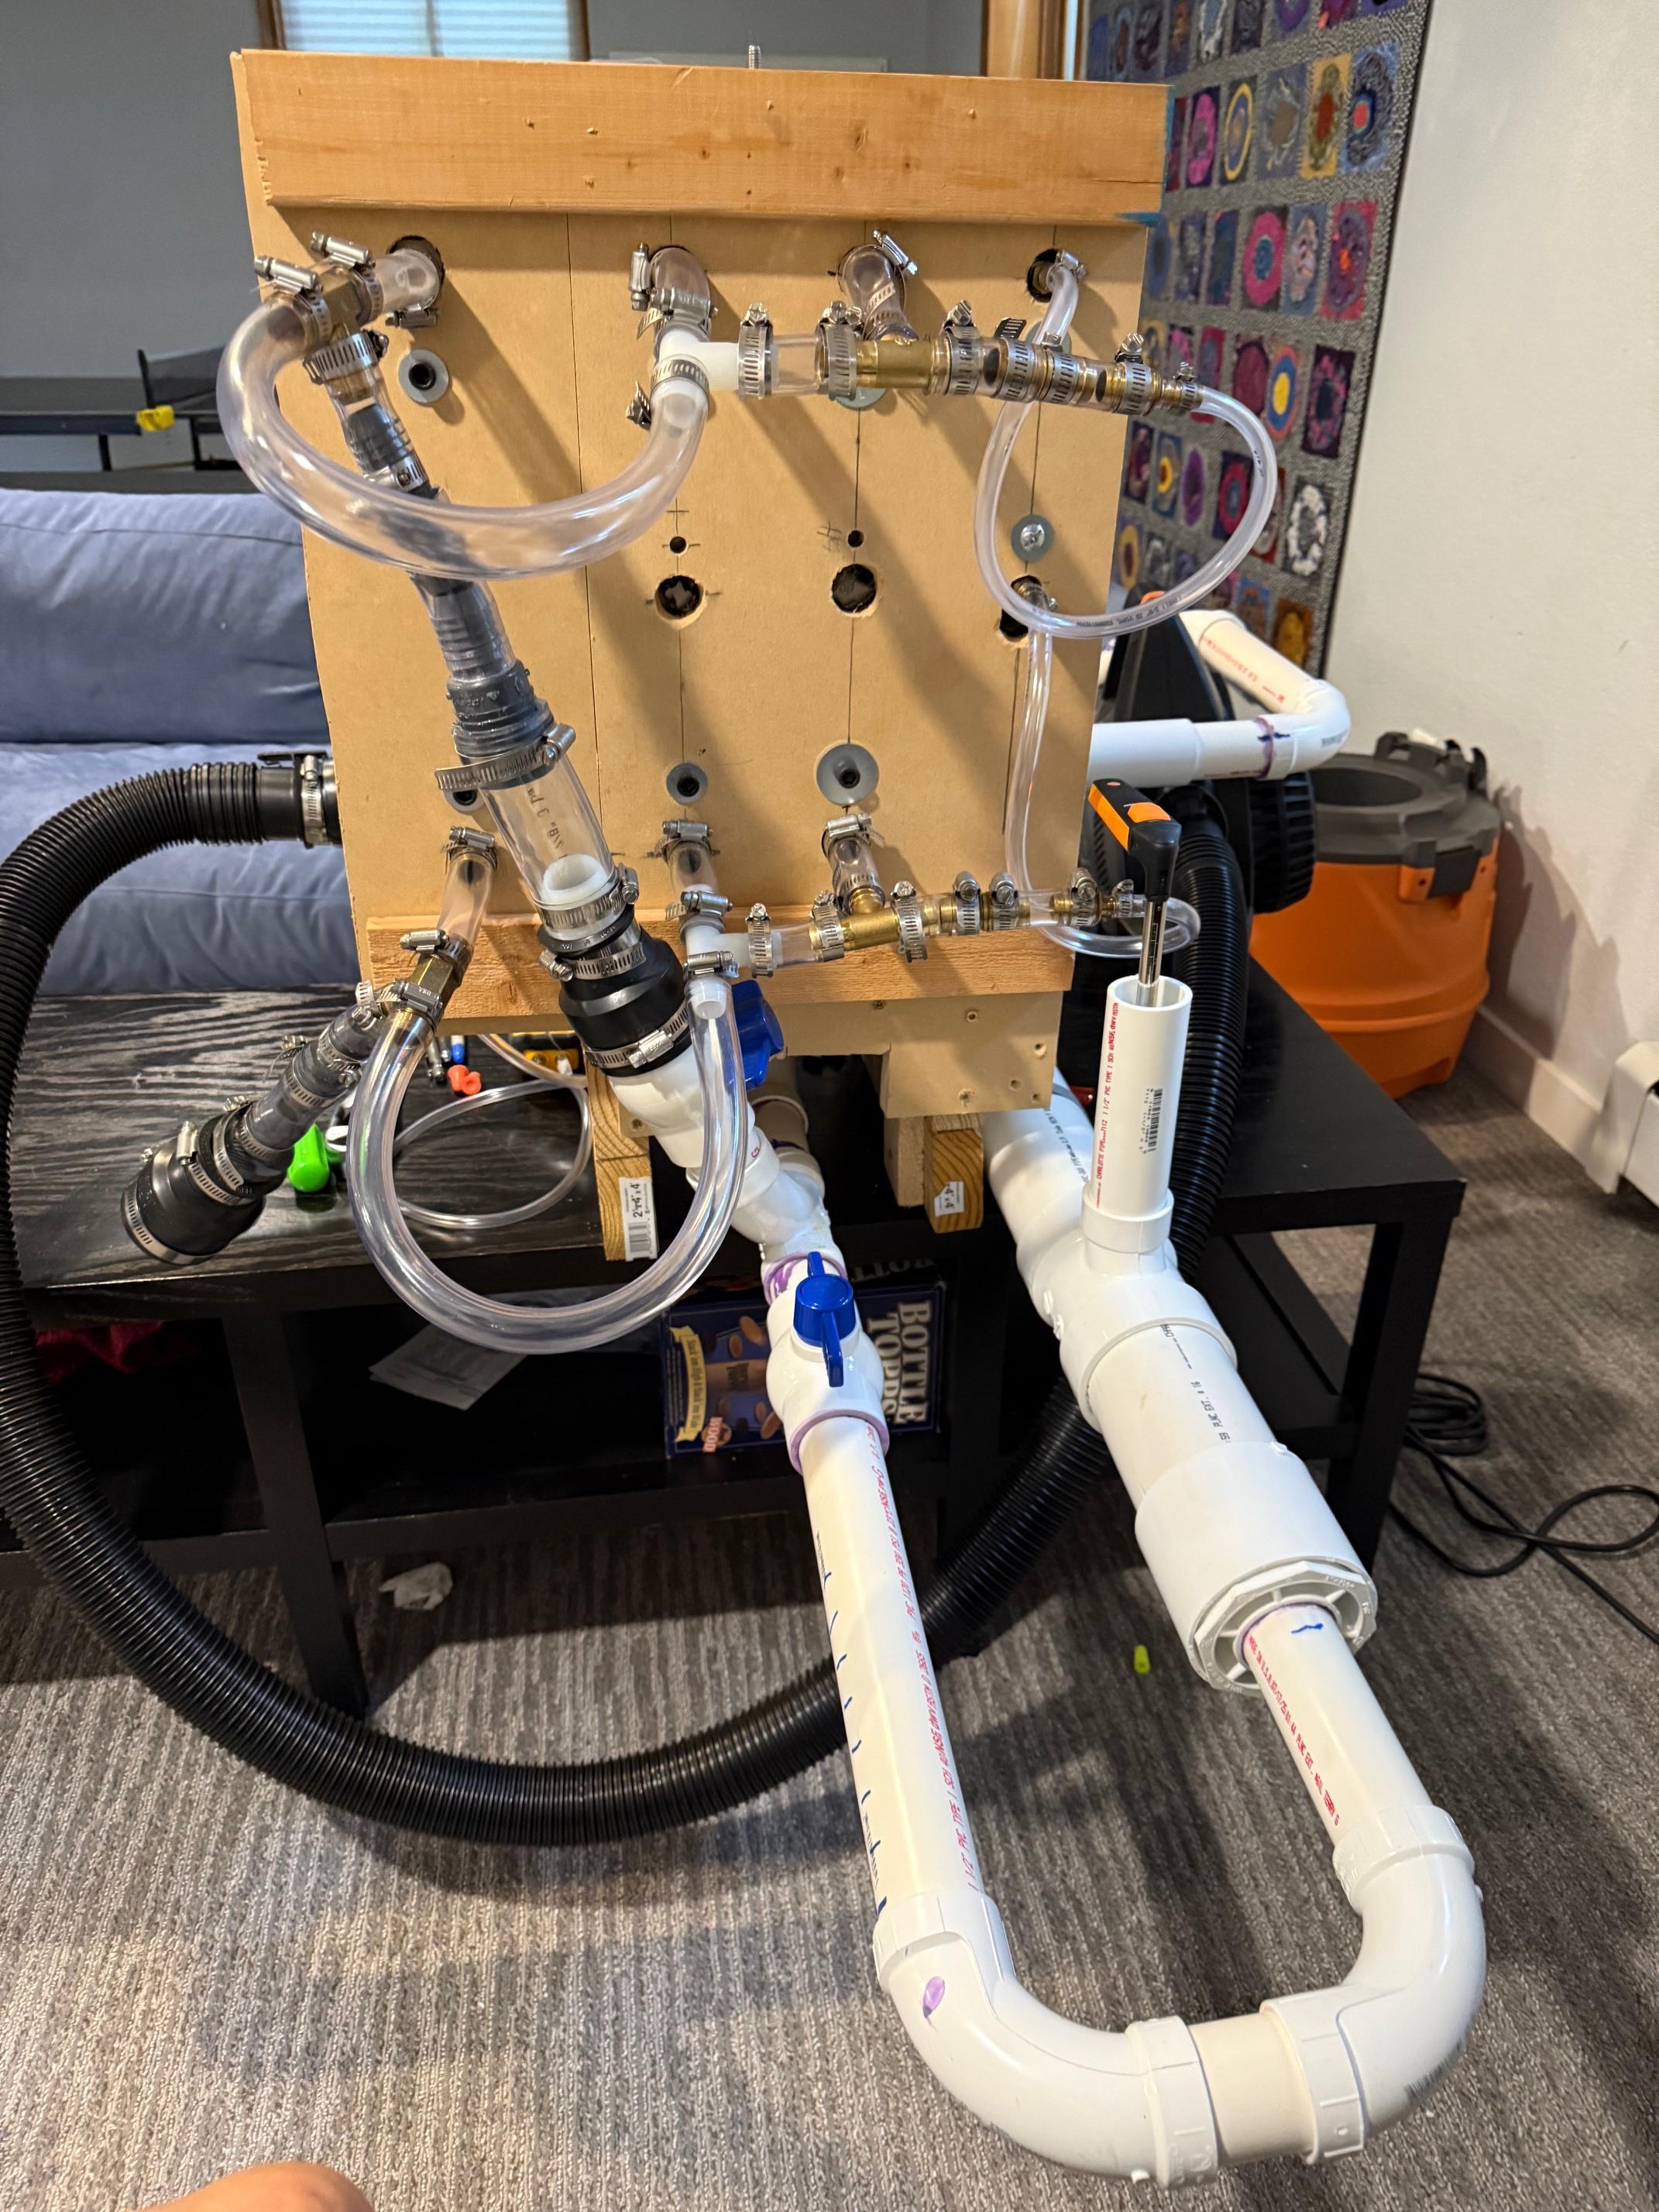
Rear View
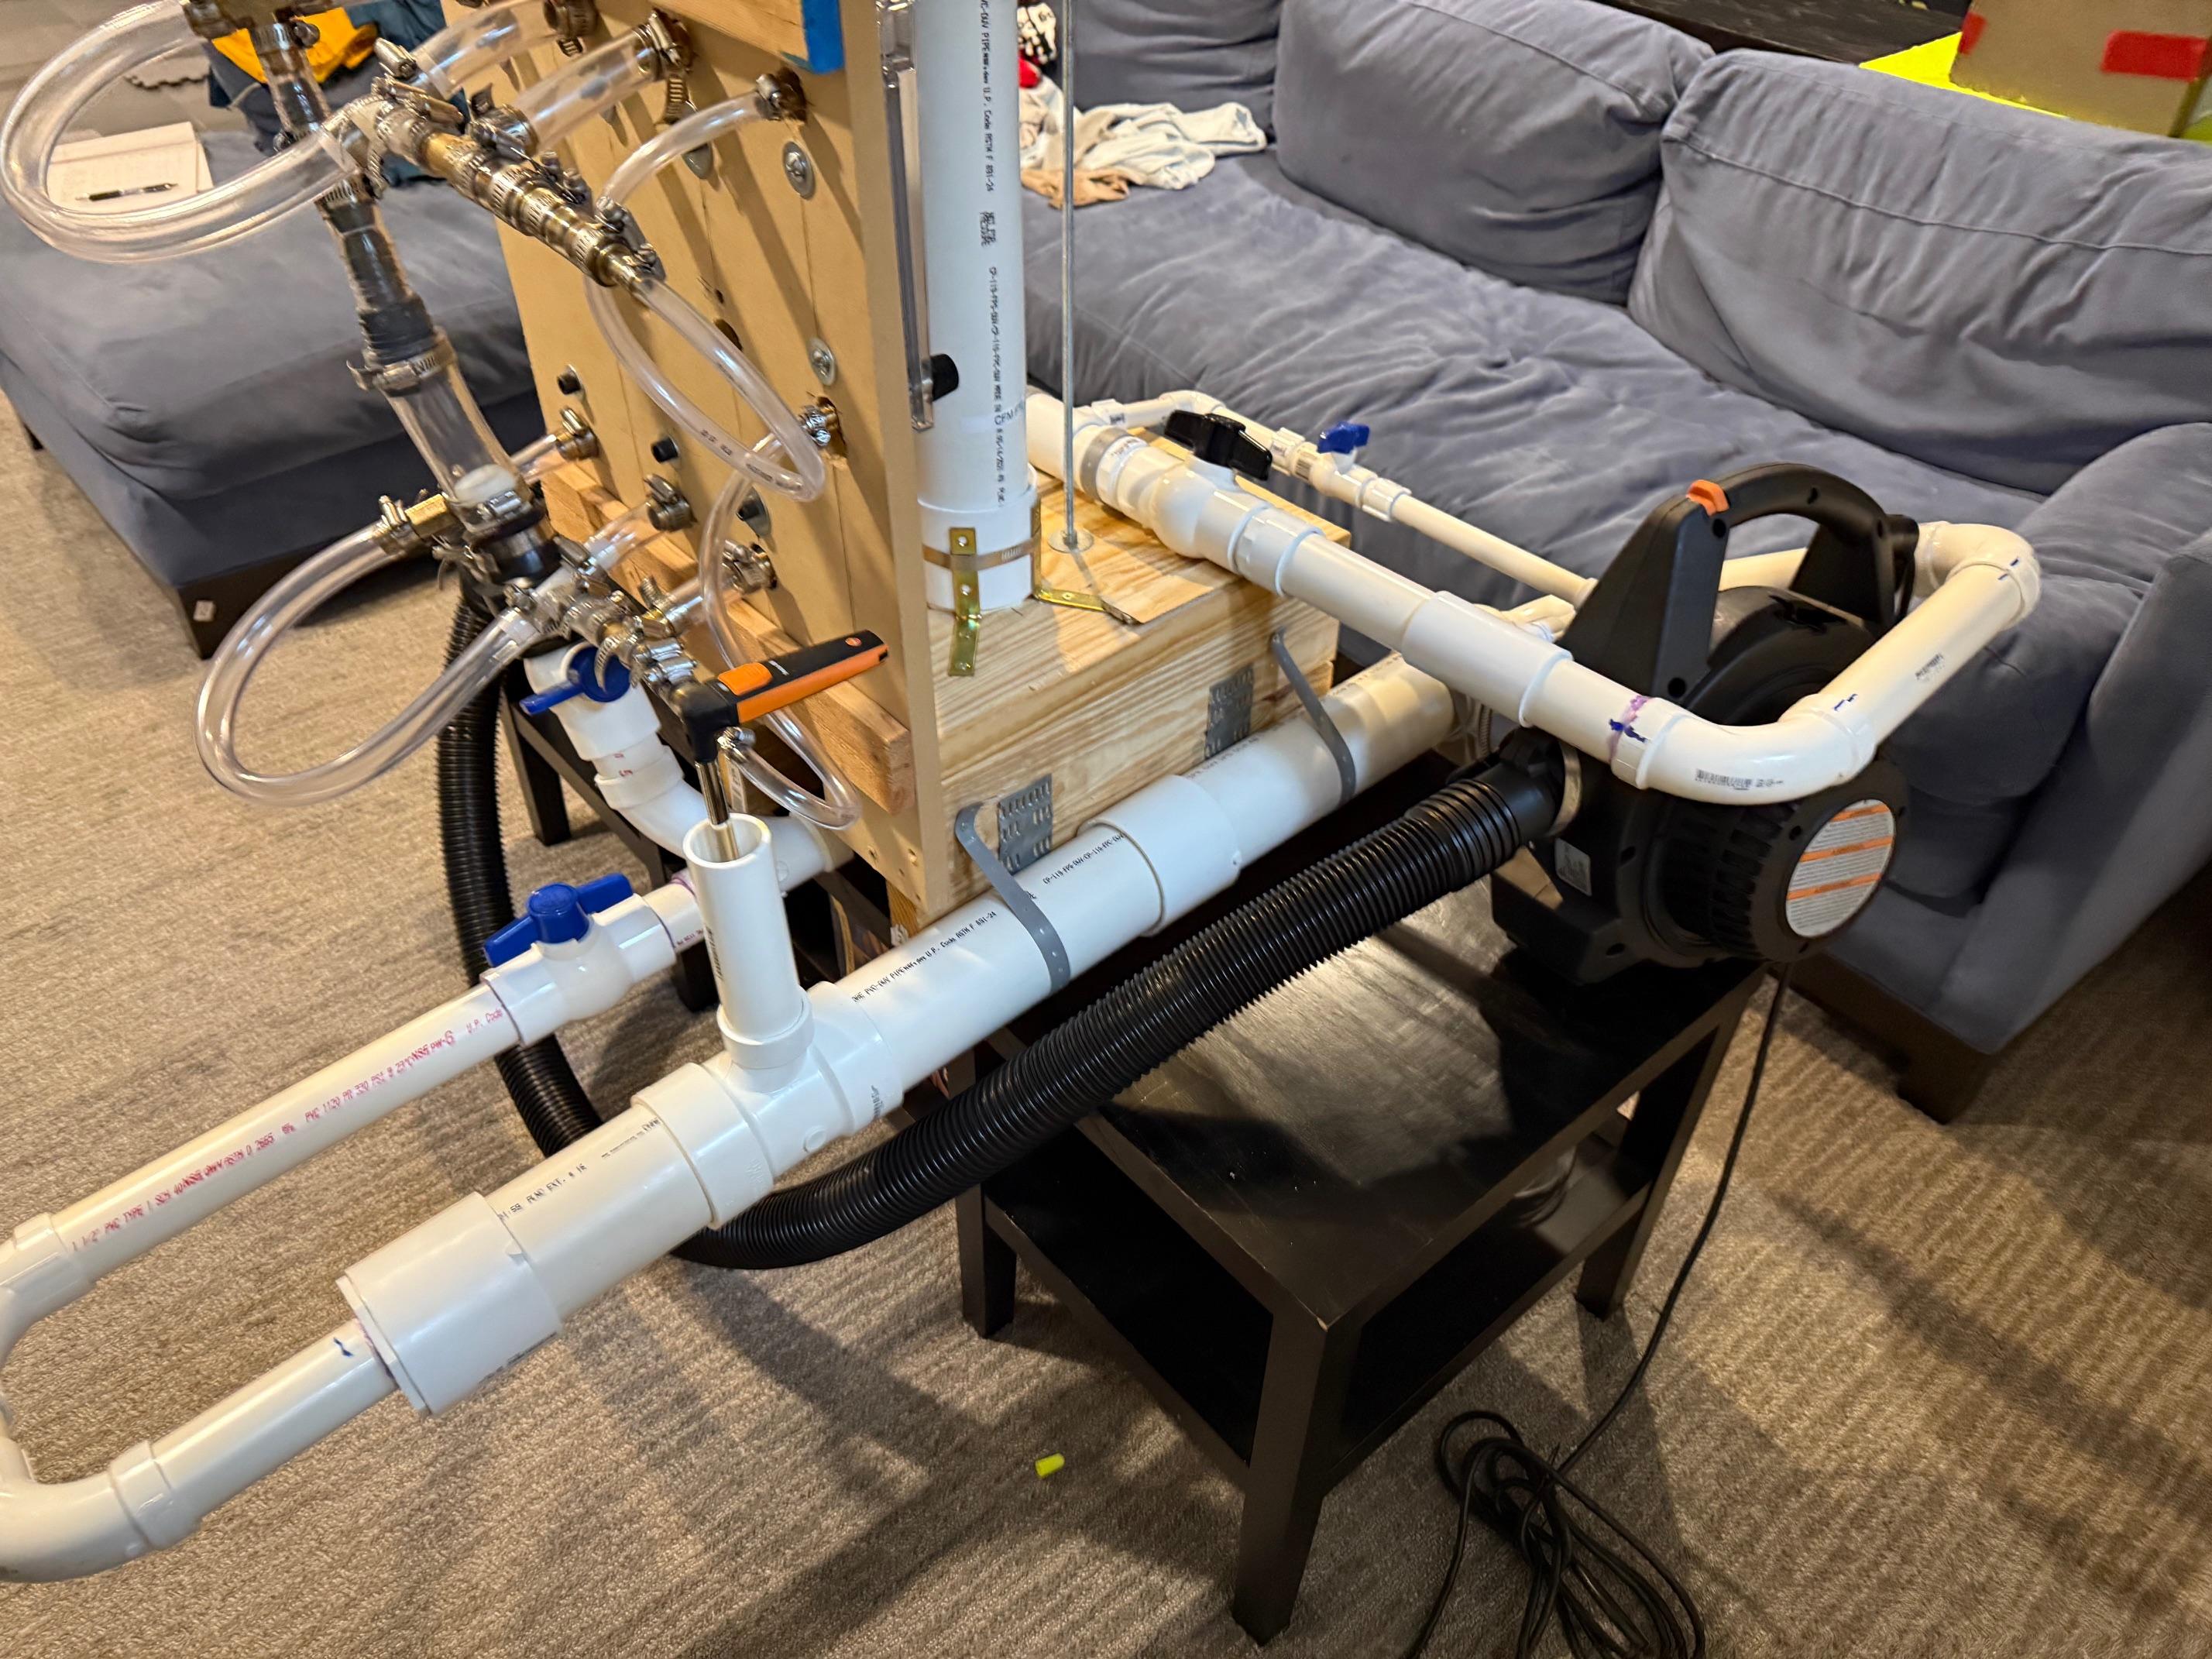
Left Side View
What you see in the images is not what the new device was supposed to look like.
After I assembled the first version for testing, I found that, despite the claims of its specifications, the Testo Hot Wire Anemometer could not measure air flow speeds through the device that corresponded to very low air permeability rates. Thus, my design objective of measuring the target range of air permeability rates with a single device could not be met. This failure could possibly have been addressed by adding orifice disks inside the 3” vertical discharge duct. That would have been a risky, big project, while adding operational complexity. Instead, I simply took the variable orifice metering assembly from the version 3 platform and bolted it onto the new platform. I then arranged all the new piping to accommodate the new platform in the most ergonomic manner I could devise.
Here is what you see in the front view: The large vertical tube is the test discharge duct. It is taller than in version three to achieve an even less turbulent air flow. The clamping board has been widened to provide a more secure and fail-safe clamping mechanism. The orifice through the clamping board is now 2.75”, rather than 3” in version 3, to conform with the requirements of ASTM D737.To the left of the vertical discharge tube is the vacuum cleaner blower motor (it is removable for blowing leaves). The blower’s black hose feeds air at the right side of the PVC tubing. The 1.5” and ½” PVC tubing in front of the old metering allows for setting the air volume to achieve the required 0.5” wc of pressure. There are three ball valves to control the flow. The first is a dump valve (hard to see) that maintains the internal air pressure throughout the system at no higher than the required test level. The second ball valve provides for gross adjustment of airflow through the system. The small ball valve is on a parallel bypass tube. This valve permits fine adjustment of the airflow through the system.
The air leaves the flow adjustment section and is directed by the piping to enter a 3” diameter, 40” long duct located at the bottom, left of the platform. This is the air volume measurement duct. The length of the duct was determined to minimize air turbulence as it travels through the air speed monitoring device. This device is a Testo 405i Bluetooth hot wire anemometer. This unit was selected because of its small probe size and long, rigid probe support mechanism. This configuration enabled a rigid, permanent mount within the air stream through a “T” pipe coupling. Its data is sent to an app on my phone. Very convenient. The anemometer multiplies the measured air speed by the duct diameter to calculate the airflow through the device in cubic feet per minute (CFM). This flow will remain constant throughout the device, regardless of the air speed at any particular point within it. As will be discussed later, I enter a calibration factor into the Testo, along with an atmospheric pressure reading. This permits the Testo to output CFM in terms of Standard Air Conditions at sea level, rather than results that correspond to my 5050 feet elevation in Colorado.
In the left-side view photograph, you can see the piping that takes air from the air measurement duct and sends it into the bottom of the discharge duct.
In the rear view, you see two more valves.
When I modified the design by bolting on the old measurement instruments to handle low air permeability measurements, I had to develop a method to feed air from the blower into either the HP (high permeability instrument) or the LP (low permeability instrument). I also needed a path for air to leave each device, enter the final air discharge duct, and pass through the test fabric.
Either device is fed air by attaching the blower hose to the appropriate flexible coupling. The discharge air of each device enters the PVC piping to the discharge duct through its own ball valve. The ball valve in the path of the HP or LP that is in use will be opened. The other valve will be closed. This eliminates a potential source of air turbulence.
Discharge air now moves up the discharge duct. 3” below the top of the duct is a ½” PVC tube. This tube attaches to a pressure port from which a digital, 2-channel manometer measures the air pressure below the test fabric. This is the data used to adjust the valves that control the air volume flowing through the HP system.
A valve at the bottom of each airflow meter controls the air volume flowing through the LP system. These valves are seen in the front view.
Calibration
Any instrument requires a calibration procedure that ensures its results are comparable to those produced by other instruments. In the case of the air permeability tester, calibration is achieved by measuring the air flow through a series of disks that contain orifices in various sizes at .5” wc. The measured air flow values are then compared with calculated values for each disk at Standard Air Conditions.
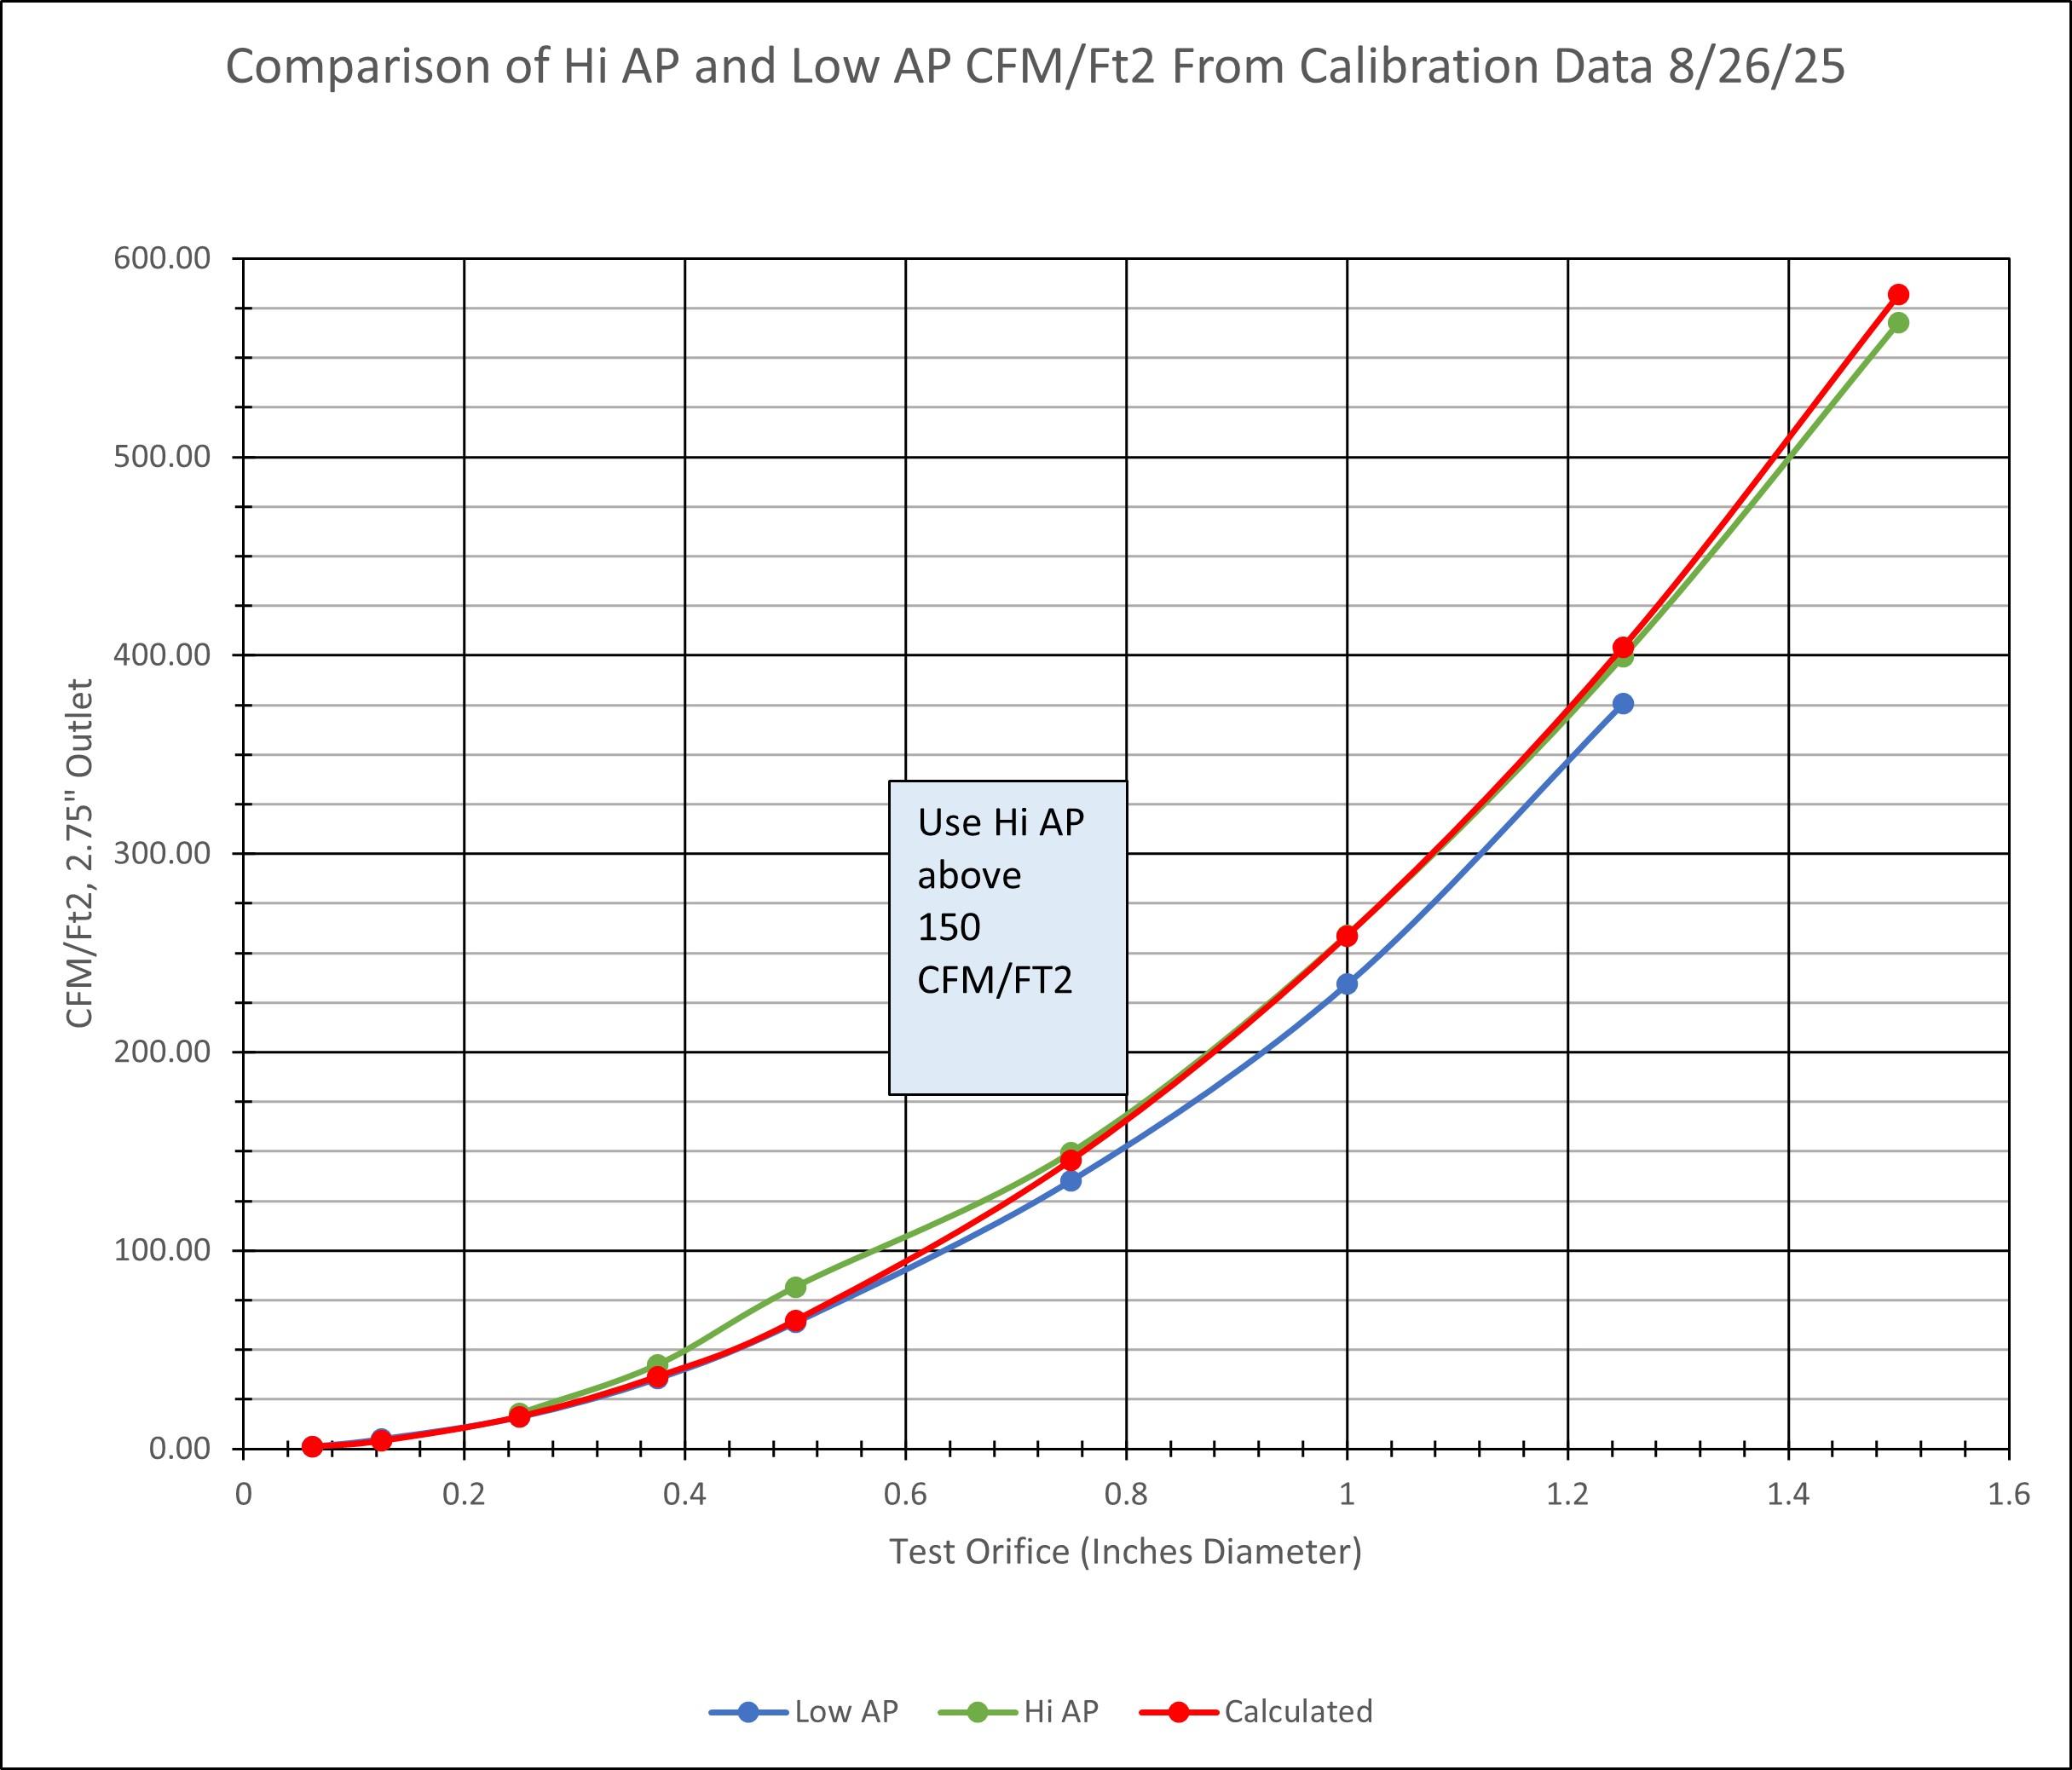
In this machine, I was able to convert the values for each calibration disk to the equivalent for the system discharge orifice size of 2.75”. This data can then be plotted on a calibration curve for the system, illustrating the deviation between the calculated data and the measured data across the entire operating range of the device.
This calibration curve is shown below.
The red curve shows the calculated calibration values that the device must match. We can see that at flows below 150 CFM/Ft2, the green Hi Air Permeability plot deviates from the calculated plot. Similarly, at values above 150 CFM/Ft2, the Low Air Permeability plot deviates from the calculated plot. As a result of this calibration plot, we can be confident that we will obtain reliable data by using the Hi device for air permeabilities above 150 CFM/Ft². The Low device will be used for all other measurements.
Variances for the test ranges do not exceed 6%. There are two exceptions. The calibration yields variances of around 20% for the two low air permeability measurement points. This corresponds to the range of 1 to 12.5 CFM/Ft2. I think this is due to the inability to accurately measure the very low airflows that occur due to imperfections in the calibration disks and/or aerodynamic instabilities in the system.
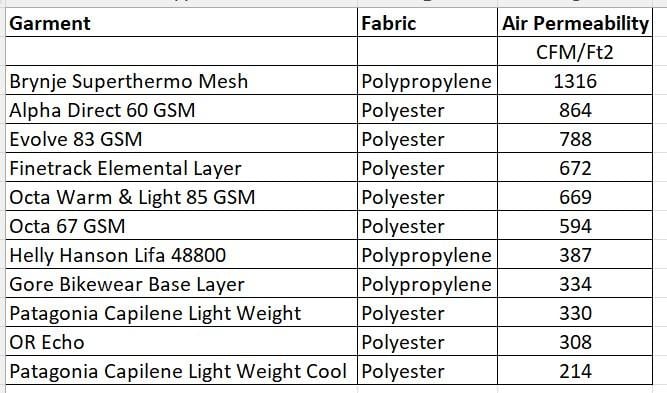
Measured Air Permeability Data
As part of the calibration process, I measured the air permeability of 11 fabrics with high air permeability. This includes Alpha Direct 60 gsm and Brynje Superthermo mesh. As a reality check, I had the air permeability of Alpha Direct 60 gsm tested by Diversified Testing Laboratories in October 2023. They measured an air permeability of 865 CFM/Ft2. In the present test, I measured the same fabric at 864 CFM/Ft2. I think that is an acceptable deviance. In producing these numbers, I did not determine the maximum air permeability I can measure with the new device. I measured the Brynje mesh with the dump valve completely open. There is a lot of measurement capacity left. I expect this machine can measure any fabric out there. Time will tell.