Topic

Long Term Weather Planning at Elevation

Viewing 10 posts - 1 through 10 (of 10 total)
David D BPL Member
PostedAug 10, 2025 at 9:21 pm

I’m planning a trip for the first week in September in British Columbia’s Iceline and Rockwall trails.

Weather forecasts can be taken from https://spotwx.com/ or https://www.mountain-forecast.com/peaks/Mount-Field-British-Columbia/forecasts/2643 but these only extend out by 7 days.

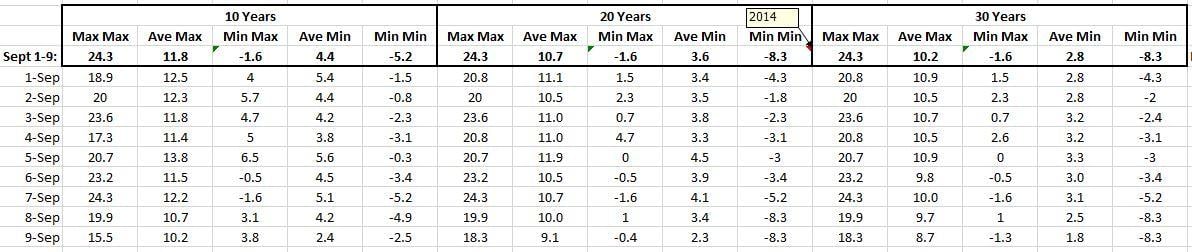
I need to plan several weeks ahead, using historical data.  After checking the weather station map (here), and then the Canadian records here, it seems the closest reliable historical daily data available (monthly is too coarse for a shoulder month like September) is for Banff

https://weatherspark.com/y/2254/Average-Weather-in-Banff-Alberta-Canada-Year-Round

[unfortunately there is no comparable data in Canada like you have in the US at https://www.ncei.noaa.gov/maps/normals/%5D

Since Banff is at a lower elevation (~ 1,380 metres/4,500 feet) and Iceline and Rockwall peak at ~ 2,300 meters/7,600 feet), a “lapse rate” conversion is needed to estimate the lower temperature at the higher elevations.

I unleashed ChatGPT5, and it recommended using ~6.5 °C/km (3.6 °F/1000 ft), taken from

  • World Meteorological Organization (WMO) — defines the International Standard Atmosphere (ISA) with a mean tropospheric lapse rate of 6.5 °C per 1,000 m up to 11 km altitude.
  • U.S. Standard Atmosphere (NOAA/NASA/USAF) — also adopts 6.5 °C/km for its baseline model.
    This rate is an average derived from long-term observations worldwide, blending both dry and moist

However, the Adirondack org here out east adopts a much more aggressive 5 to 8 degF per 1000ft.  According to ChapGPT5, the difference is because:

  • In dry sunny conditions, lapse rates tend to be steeper (closer to 8–9 °C/km).
  • In humid/cloudy conditions, lapse rates tend to be shallower (4–6 °C/km).
  • For mountainous areas like Yoho/Banff in early September, actual lapse rates on any given day can range between about 4–8 °C/km.

There’s a huge difference between these estimates.

I suspect this variation is just part of the reality of all this, but I was wondering what the group’s experiences are with estimating this?

Bonzo BPL Member
PostedAug 10, 2025 at 10:51 pm

I’m not sure exactly what you’re planning for, but I can tell you one thing about using ChatGPT to do any kind of math: if you don’t specifically instruct it to utilize Python in its calculations, you’re gambling.  Adding that instruction significantly decreases mathematical hallucinations and questionable answers.  Citation: my significant other, whom deals with ChatGPT professionally, and whom has been less than impressed with 5 in the day or so that it’s been out.

Second suggestion: try Perplexity.  It’s been better for data research and calculation than ChatGPT.  Bench that result against your previous ones.

Bill Budney BPL Member
PostedAug 11, 2025 at 2:28 am

While I generally agree with the idea of looking at the worst historical data for a place and time of year, we are in a decade of record-breaking weather, so maybe pack with that in mind. Don’t cut it too close.

Roger Caffin BPL Member
PostedAug 11, 2025 at 4:42 am

1st rule of the high mountains: if it is all fine and sunny, the storm just hasn’t got here yet.
Applies in Oz: dunno about USA.

Cheers

Terran BPL Member
PostedAug 11, 2025 at 6:31 am

Which way does the wind blow?

I figure 4*f/1.000 and I’m right about 5% of the time. It may be closer to 2*.  Depends on the local weather patterns.

Bonzo BPL Member
PostedAug 11, 2025 at 8:01 am

1st rule of the high mountains: if it is all fine and sunny, the storm just hasn’t got here yet.

Applies in Oz: dunno about USA.

It very much applies.

It occurred to me that the likely source of the deviation in temps that is being shown in the first post is simply due to their original sources.  Of the six total organizations that are cited, the first five – the ones pulled by ChatGPT – are entities chiefly concerned with scientific accuracy when it comes to weather forecasting; an outdoor-rec organization, however, is likely more concerned with overall safety, and thus more likely to encourage a higher margin thereof.

jscott Blocked
PostedAug 11, 2025 at 12:31 pm

Wait until the day before your hike and then check longer term forecasts. Pack accordingly, with the caveat that those forecasts, especially near the West coast, can go extremely wrong. So I’d suggest packing with survival in mind; that is, hypothermia etc. that said, the first weeks of September are often the best in the mountains up right at the Canadian border (Stehekin area in Wa. state) that I’m familiar with. September is the best month for stream fishing up there too! Best wishes, what a grand hike! I’m jealous.

David D BPL Member
PostedAug 11, 2025 at 10:08 pm

jscott, I’ll definitely be checking the weather before I leave but the trip is start of September when weather can be unpredictable and the forecast before I get on the plane can be stale at the end of the trip.   Using historical data lets me plan insulation carry to not only avoid hypothermia but hopefully get a decent sleep.  And thanks, this trip will be a good one; I also just came off a back country fishing week of a lifetime but that’s another story!

Bonzo, planning is for Rockwall Trail in Kootenay NP BC Canada, followed by 2 days of day hiking the Rockies from Golden BC base camp, then Yoho NP in BC: Takakkaw Falls clockwise to Stanley Mitchel Hut via Iceline Trail, then Whaleback and Twin Falls Trails to Twin Falls then next day out to Banff for a huge steak.  ChatGPTs math was fine but it based it’s analysis on a weather station that might as well have been Cuba.  I use ChatGPT in my work research and it’s often on crack.  You’re probably right that the ADKs recommend for safety because there’s no way the ADKs can be considered a dry climate: again, ChatGPT making up sh!t!

Jerry, thanks for the links but I can’t quite make out where in BC it extends to.  Turns out https://spotwx.com/ can select from forecasts out to as much as 16 days.  It’s user interface is really slick, worth a look.

TT, given the uncertainty in the method derating for elevation, I hunted down a weather station nearby that was at the same elevation as the peaks of the trails, using this web site https://clearweather.ca/dev/maponly_stnid.py?stnid=CWYL&tz=UTC&zoomlvl=6&task=wxdata&obtype=CAAUT8&obsformat=&t=&

Turns out NAKISKA RIDGETOP has quality historical data.  Pulling 30 years of csv files from Environment Canada and applying some spreadsheet elbow grease:

temps

Bill, global warming trends show in the average maximums but the worst minimum in the last 30 years was fairly recent, 2014, which is the metric that matters.  Interestingly, it’s (-8.3C) pretty close to my earlier method using the 95% worst case historical data for Banff then derating for elevation using the standards 6.5C/1000m (-7C) but maximums using that method were nowhere close.

The lesson here is to pull historical data from the correct elevation if its available.

Looks like I’ll be bringing the hunting flannel pants!

This analysis was also useful to work out the rain gear.  My preferred UL poncho is too risky at those “Min Max” temperatures if the wind is whipping.  It’ll be the first time using the dreaded rain jacket/pants combo in years.

Viewing 10 posts - 1 through 10 (of 10 total)
Loading...