Extraordinary Claims And Extraordinary Proofs
This forum and website are literally based on an extraordinary claim – "UltraLight Backpacking is possible, doable and safe, besides being fun".
The extraordinary proof is the practical experience of thousands of members and followers of this belief chalking up hundreds of through hikes on the major long trails of the United States and elsewhere in the world. It is additionally backed up by numerous published books and hundreds, perhaps, of websites of practitioners of the art offering to share their knowledge and experience.
Of course, there are really tons of doubters out there. They often don't read, and if the read they don't believe, because they have been doing backpacking the old way and simply refuse to accept that anything else could be as "right" as they have been doing. *
Extraordinary Claim of "Sweet Spot" in Compaction of Down
There has been an extraordinary claim of a sweet spot in the compaction of down where there is a "maximal efficiency" down density for warmth which is about 2.5X higher density (250% compaction) than fully lofted high loft down.
There has been no extraordinary proof.
Let me repeat that, there has been no extraordinary proof of a clear and unmistakable kind. This is following a year or two since the announcement of the "maximal efficiency" packing of down.
The data leading up to that claim has been of a sometimes fuzzy or confusing nature. Never yet have we seen a laboratory curve of the 800 fill down (or similar very high loft down) as a function of compacted density from fluffy to nearly squashed. (And plotted so that we can read off the numerical values and do reasonably accurate calculations.)
In the announcement of this alleged phenomena, the original poster (OP), cited some NIST data said to be down which showed the fundamental decrease of thermal conductivity as a function of density with 7 samples.
Then the OP showed a plot of about 550 to 600 fill down from a Natick 1990 technical report with just 4 down data points, one of which (about 2.2 lbs/ft^3) was the "Max Loft" and the second data point (at 5 lbs/ft^3) was labeled "Max Efficiency"
We will look at these initial leading arguments for the extraordinary claim in detail.
NIST Data
The NIST data are on the NIST website in the form of a database for CONSTRUCTION MATERIALS. The materials shown were all called "feathers" as is seen in the first two figures below. The first figure is nearly impossible to read but it was presented as evidence and the second is after a 3 minutes work to make it more readable using GIMP, a free graphics program. The "Feather" label is visible.
2 figures
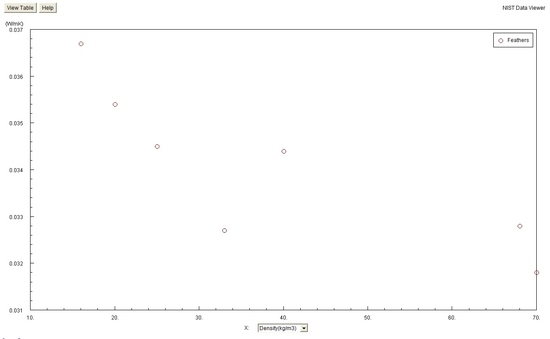
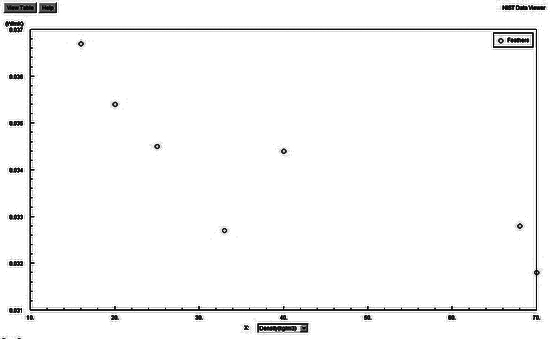
Both plots are "hidden zero" type plots, that is they are exaggerated in plotting scales to blow up or magnify any small variations or trends there may be in the data points. The next figure shows an Excel plot of the data above with the zero of density and conductivity included.
Figure
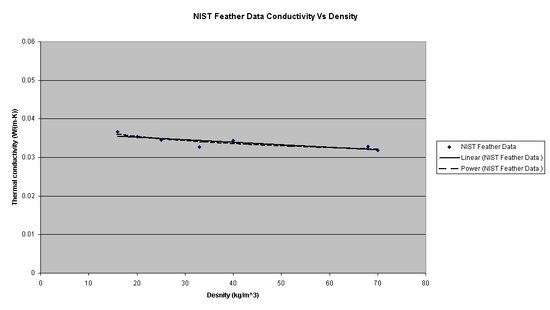
Now you can see that the large downward trend of decrease of thermal conductivity with density that was claimed is not really a major factor at all. There is no way that this plot should have ever been considered as extraordinary proof of an extraordinary claim. There is no reason for anyone to consider it as such. This plot was a classical example of unfortunate magnification of small differences – and it appears built into the NIST database.
Natick Data on Down (Natick TR/tr90/030 1990)
Thanks to Dr Philip Gibson, I obtained a copy of the Natick TR/Natick/TR90/030 of which he was the prime author. I have extracted the original figure which is shown along with the figure that the Original Poster presented. (below)
2 figures


The original figure compared four different insulation materials for thermal conductivity vs. density, of which down (said to be 550 fill, but the 2.2 lbs/in^3 density indicates closer to 600 in^3/oz).
The OP figure deleted all of the insulations except down, which is perfectly OK, leaving only the 4 data points for down, and added the labels "Max Loft" and "Max Efficiency" on/near the lowest and second lowest down densities.
There is supposed to be a "linear region" but that may be hard to identify from only four data points.
I have digitized the data points in the OP figure by means of a Open Source graphical digitizer (Engauge Plot Digitizer), and used these digitized data points to generate an Excel plot with proper placement of the zeros of the X and Y axes. That is below. (Hindsight suggests that I should have digitized the original Natick figure instead.)
Figure

I have added as labels the data values for thermal conductivity as obtained from digitization. The lowest density points are at .22 lb/ft^3 and 0.50 lb/ft^3 with conductivities of .318 and .265 (Btu-in/hr-ft^3-DegF). These are labeled "Max Loft" and "Max Efficiency" respectively.
So, the density ratio is 0.5/0.22=2.27X and this should be the thickness ratio of a down layer compressed by exterior clothing. The Thermal Conductivity ratio is .265/.318 = .833. So, the "Maximum Efficiency" occurs when the density soars by 1.31 X, the thickness drops by 1/2.27 = 0.44 or more than half meaning that if the conductivity didn't change, the heat flow would soar by 2.27 times. In actuality the thermal conductivity does drop to 0.833 of the original value so that at "Max Efficiency" the heat loss flow is 0.833X2.27 = 1.31 X that of "Max Loft".
"Max Efficiency" therefore has HIGHER HEAT LOSS than "Max Loft".
In short, the thickness drops by a heck of a lot, but the conductivity doesn't change by as much as 20%.
So how can the indicated point actually be "Max Efficiency"?
The Extraordinary Claim (as applied to the 550 – 600 fill power down) was presented without Extraordinary Evidence.
I would need to see or hear the calculations that prove that the Natick data substantiates the claim of a point of "Maximum Efficiency" and specifically how it supports the labeling of the graphs above.
Why didn't anyone see this before? Was the use of "hidden zero" plots a part of the oversight? **
Both of the books called "How to Lie with Statistics" and "How to Lie with Charts" have negative comments on, and examples of, how misleading it can be to readers to have graphs with "Hidden Zero" points of the axes. Both books can be ordered from Amazon.com or may be available in local libraries or more likely University libraries. (Newspapers and magazines routinely use such “hidden Zero” plots, by the way, as they appear very convincing.)
Before I retired, I spent time finding stuff like this in other people's writings in order to help protect my employer. I had hoped I didn't have to do this kind of work again.
I claim no great experience with down – goose or duck. I claim significant experience in rooting out technical errors of logic and errors of scientific or other proof.
The lack of data on the effect of compression (density) on the thermal conductivity of down makes difficult a discussion of the "Max Efficiency" of down packing as being at 250% compression from free loft.
I sense the lack of compelling evidence here. I have additional lacks of compelling evidence that I will present in part 2 of this. Should part 2 even be needed, that is.
* In 1982, one of the junior staff at work talked to me and my backpacking buddy about how he and his wife backpacked in the Sierra Nevada Mountains in the summers. NO backpack, NO sleeping bags, NO heavy boots, NO tent. Daypacks, a down quilt, athletic shoes and a tarp in case of rain. We couldn't believe that he survived. Too bad that in 1982 I didn't accompany them of a trip. Most of the last 30 years of my life could have been changed in a major way.
** I have a relatively simple theory of how an alternative interpretation of the density data and its treatment could lead directly to the appearance of the "Max Efficiency" concept even for the 500-600 fill down data presented in this discussion.